Incident Detail with AI Analysis
Note: The new incident detail view is currently in Beta and subject to change.
The new Incident Detail page presents an overview of the AI analysis and evaluation of the incident, indicating whether it is likely a true or false positive threat. The agentic AI assesses incidents in a manner similar to a human analyst, systematically forming and validating hypotheses. It analyzes individual detections, observables, indicators, and their combination, to identify a threat narrative consistent with the incident data. The final classification, along with reasoning, supporting evidence, and recommended response steps, is displayed in the incident detail view.
Note: The incident detail view with AI analysis is not available for legacy incidents, including incidents that are directly promoted from Secure Cloud Analytics and incidents created using Cisco XDR APIs (for example, via an Automate workflow). If possible, we recommend that you use the Custom Security Events feature instead of creating incidents directly via API. These events will generate detection in Cisco XDR, which are considered for incident correlation and the incidents are analyzed by AI.
On the Incident Detail page, click Launch new incident view in the upper right corner in incident detail to open the new incident detail view. To close the new incident detail view and return to the previous incident detail view, click Classic view in the upper right corner.

In the incident detail header of the Overview tab, you can view the incident name, status, who has been assigned to the incident, classification of the incident, confidence level, product sources that contributed to the data, and a list of the MITRE ATT&CK® tactics, techniques, and sub-techniques impacting the incident based on the Financial Risk Score (probability of financial impact if the MITRE ATT&CK® patterns are not mitigated). If three or more tactics, techniques, and sub-techniques are listed, the number of additional items is displayed beside the list. Click the + link to expand the list and click the View less link to collapse the list. For more information on MITRE ATT&CK®, see MITRE ATT&CK Matrix for Enterprise. It also displays the following tabs that open in the right pane: Response, Evidence, Worklog, and Report.

Click the ![]() (Options) icon at the end of the incident name and choose Support details to open the Support details drawer that is used by Cisco support and it is for troubleshooting purposes only. To hide the left pane, click the
(Options) icon at the end of the incident name and choose Support details to open the Support details drawer that is used by Cisco support and it is for troubleshooting purposes only. To hide the left pane, click the ![]() (Hide) icon to the left of the classification tag.
(Hide) icon to the left of the classification tag.
You can change the status of the current incident in the status drop-down list. If you change the incident status to any of the Closed statuses, the Additional info text box is displayed for you to provide feedback on whether the AI-generated analysis was accurate for the current incident how we can improve the incident analysis. For more information on the statuses, see Available Statuses.
You can assign or unassign users by clicking the avatar with the user's initials or the Unassigned link in the upper right corner of the header . When the incident is assigned, an avatar with the user's initials is displayed and you can hover over the avatar to view the user's full name in a tooltip.
For more information on assigning users to an incident, see Assign Incident.
The incident classification tag at the top of the page is determined by analyzing compromised or suspicious devices, user behavior and activities, and individual detection events and their classifications.
-
Decisive True Positive - There is a high confidence that malicious activity has occurred with clear attack patterns.
-
Likely True Positive - There is strong evidence that malicious activity has occurred with some uncertainty.
-
Likely False Positive - There is an indication that the activity is likely benign with some suspicious elements.
-
Decisive False positive - There is a clear indication that a benign or authorized activity has occurred.
The confidence tag indicates the overall confidence of the incident classification (High confidence, Medium confidence, or Low confidence) and it is based on the following factors:
-
Completeness - Measures the data availability and coverage.
-
Threat Intel quality - Assesses the quality and relevance of the threat intelligence available during the investigation.
-
Narrative - Evaluates how well the observed events form a coherent, evidence-based analytical story with relationships between events.
-
Behavioral coherence - Measures the consistency and logical attack of the observed behavior.
You can provide feedback on the current incident by indicating whether the AI-generated analysis was accurate while reviewing the incident by clicking the Provide Feedback link. A text box is displayed for you to provide more information on what was incorrect and how we can improve the incident analysis. Your feedback helps us expand the knowledge base used by our AI agents to improve incident analysis, classification, and response. Click Submit to send your feedback. The Additional info text box is also displayed when you change the incident status to any of the Closed statuses. You can view user feedback in the Worklog tab.
Note: Your feedback submission does not regenerate the AI analysis.
The Summary panel displays a concise conclusion of the incident, leading with the classification verdict and expanding with key technical details such as affected hosts, attack techniques, and behavioral patterns.

The Reasoning panel explains the analytical steps behind the conclusion — why specific activity was classified as malicious or benign, how detections were correlated, and what contextual factors influenced the verdict. The Evidence panel lists the most significant concrete indicators from the investigation, such as detection product findings, file paths, hashes, IP addresses with reputation context, and process activity.
The Detections panel displays a list of security events that have been analyzed and correlated by Cisco XDR to determine the relationships between events, such as shared observables, overlapping timelines, and related attack patterns. When events are determined to be part of the same threat, they are grouped to create incidents in Cisco XDR. For more information on security events, see Detections. Click the View details link to display details of the detection in the right pane. See View Detection Analysis Details for more information. Click the View more or View less link to display more or less detections.
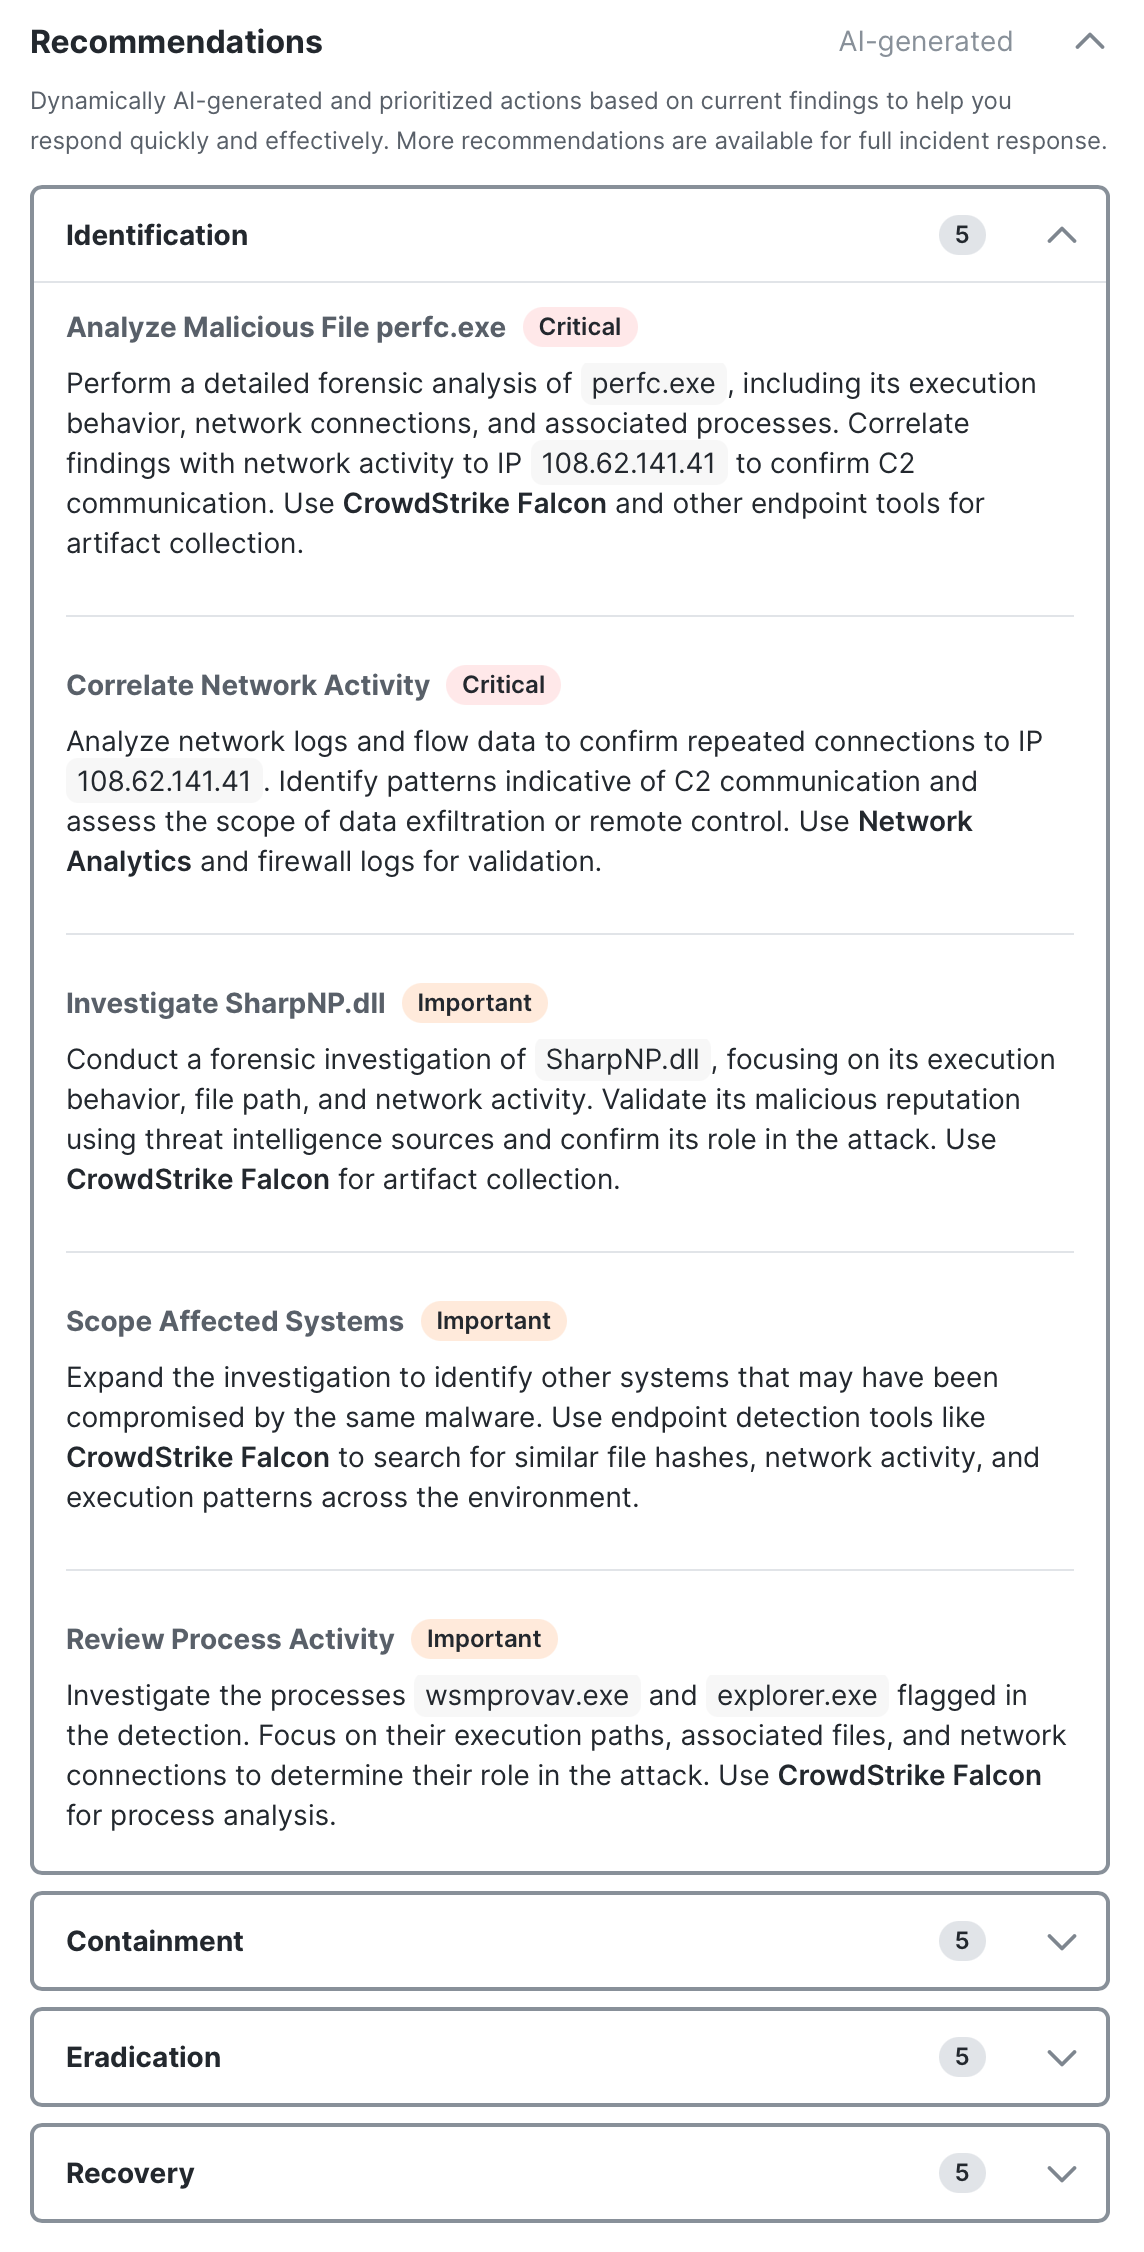
The Recommendations panel displays a list of AI-generated recommended actions based on playbook tasks to help you respond quickly and effectively. The recommendations are organized by playbook phases that can be used to assist in identifying, containing, and eradicating the threat, and then restoring systems to recover from the threat. Each phase has prioritized and detailed response actions, offering guidance to resolve the incident, such as isolating compromised hosts, containing lateral movement, and acquiring forensic evidence. The priority tag (Critical, Important, or Optional) indicates the urgency based on the incident classification alignment. Click the View more or View less link to display or hide additional description details. The task status is displayed as a color-coded tag in the upper right corner. For details, see View Task Status.
Note: The Recommendations panel does not list tasks with a Complete or Not applicable status.
The Incident response progress bar at the top of the panel displays the number of tasks with a Complete status out of the total number of tasks for all the phases in the Response tab. Click the View all tasks in Response tab link to view all the tasks in the Response tab. For more information, see Response.
When you click a task in the list, the task drawer opens where you can quickly view the notes that were manually added to the task and results of any automated workflows that have been executed for the task. For details, see View Task Details in Drawer.
For each phase, the number of recommended tasks out of the total number of tasks for all the phases in the Response tab is displayed at the bottom of the panel. Click the View all tasks in Response tab link to view all the tasks in the Response tab. For more information, see Response.
If applicable, click the Execute button to run the recommended workflow for the entire incident or specific observables within the incident. The observables drawer opens and the observables that are recommended by AI are automatically checked in the observables drawer based on the incident analysis. For more information, see Execute. Expand View task notes to display up to the two most recent task notes, which consists of manually added notes and results of any automated workflows that have been executed for the task. Click the View task drawer link to view all the task notes in the task drawer. For details, see View Task Details in Drawer.
The ![]() (Add Note) icon allows you to manually add notes about the incident as you go through the recommended tasks. See Add Manual Note for details. For AI-generated tasks, a note is automatically added by AI to summarize the analysis of the asset or detection based on the security events, logs, and observables in the incident.
(Add Note) icon allows you to manually add notes about the incident as you go through the recommended tasks. See Add Manual Note for details. For AI-generated tasks, a note is automatically added by AI to summarize the analysis of the asset or detection based on the security events, logs, and observables in the incident.
The Analysis panel displays a AI-generated summary of the device and user activities using insights from asset data in Assets and detections.

The asset classification tag at the top of the page is determined by analyzing compromised or suspicious devices and user behavior and activities.
-
Compromised - High confidence of successful adversarial data exfiltration. The asset has been taken over or abused by a threat actor.
-
Suspect - Indicators suggest potential compromise requiring immediate investigation. There are signs of malicious activity but confirmation is incomplete.
-
Clean - No credible evidence of compromise in the available data. The asset appears unaffected based on analyzed telemetry.
The confidence tag indicates the overall confidence of the asset classification (High confidence, Medium confidence, or Low confidence) and it is based on the following factors:
-
Completeness - Measures the security data availability and coverage across controls, log sources.
-
Threat Intel quality - Assesses the quality and relevance of the threat intelligence available during the investigation.
-
Narrative - Evaluates how well the observed events form a coherent, evidence-based analytical story with relationships between events.
-
Behavioral coherence - Measures the consistency and logical attack of the observed behavior.
Each asset includes a ![]() (Pivot Menu) icon that enables you to take action on it. You can perform some actions directly in the Pivot menu or pivot to the integrated product to perform additional actions. For details, see Pivot Menu. Click the View details link to display the device or user details in the right pane and click the View more or View less link to display or hide additional assets.
(Pivot Menu) icon that enables you to take action on it. You can perform some actions directly in the Pivot menu or pivot to the integrated product to perform additional actions. For details, see Pivot Menu. Click the View details link to display the device or user details in the right pane and click the View more or View less link to display or hide additional assets.
The device or user details page in the right pane displays the following:
-
Device or User analysis - Summary of the activity with key findings and recommendations.
-
Device or User analysis timeline - The Device analysis timeline area displays the chronological timeline that combine findings from a group of detections. Click the detection group link in the Detection Groups area to display the detection details on the Detection Analysis page. For more information, see View Detection Analysis Details.
-
Device or User details - The Device details or User details area provides more information about the device or user. Click View all to list all the details on the device or user, including device ID or user ID. For more information on the asset details, see Devices and Users.
The Detection Analysis Details in the right pane displays a detailed analysis of the group of security events to determine the nature and significance of the detected activities. The detection classification tag in the Detection Analysis area is determined by analyzing individual security events and their classifications.
-
Decisive True Positive - There is a high confidence that malicious activity has occurred with clear attack patterns.
-
Likely True Positive - There is strong evidence that malicious activity has occurred with some uncertainty.
-
Likely False Positive - There is an indication that the activity is likely benign with some suspicious elements.
-
Decisive False positive - There is a clear indication that a benign or authorized activity has occurred.
The confidence tag indicates the overall confidence of the detection classification (High confidence, Medium confidence, or Low confidence) and it is based on the following factors:
-
Completeness - Measures the data availability and coverage.
-
Threat Intel quality - Assesses the quality and relevance of the threat intelligence available during the investigation.
-
True Positive Narrative - Assesses the strength of the evidence to support a malicious narrative.
-
False Positive Narrative - Assess the strength of the evidence to support a benign narrative.
Related Detections
The Related Detections area displays a list of detections that contributed to the detection analysis. Click a detection link to open the detection details page that lists the detection details, such as a brief description, source product, detection ID, and associated MITRE ATT&CK® tactics and techniques. The Activities area displays a list of related activities for the detection. Click an activity link to open the activity drawer with more information on the activity, including endpoint, traffic and connection, and device details. Click Copy JSON to copy the activity displayed in JSON format.
The JSON area displays the raw logs for the security event and related activities in JSON format. Click Copy or Download to copy or download the data displayed in JSON using the Industry Standard Open Cybersecurity Schema Framework (OCSF), version 1.4. You can also search for keywords in the Search field, with Case sensitive, Regular expression, and Whole word options available to refine the search.
Analysis of Observables
The Analysis of observables area displays a detailed analysis of the observables from all the events related to the incident. The classification tag displayed the analysis of the individual observable: Malicious, Suspicious, Benign, or Inconclusive. Click View JSON to open a drawer that displays the observable in JSON format. Click Copy or Download to copy or download the data displayed in JSON. You can also search for keywords in the Search field, with Case sensitive, Regular expression, and Whole word options available to refine the search.
The Event Timeline panel provides a chronological view of events based on the incident investigation and analysis by agentic AI. Click the ![]() (Highlight on graph) icon to highlight the event in the attack graph in the right pane. The MITRE ATT&CK® tactics, techniques, and sub-techniques impacted by the event are displayed as tags. For more information on MITRE ATT&CK®, see MITRE ATT&CK Matrix for Enterprise.
(Highlight on graph) icon to highlight the event in the attack graph in the right pane. The MITRE ATT&CK® tactics, techniques, and sub-techniques impacted by the event are displayed as tags. For more information on MITRE ATT&CK®, see MITRE ATT&CK Matrix for Enterprise.
Note: The events based on AI analysis are not available for incidents that were created prior to April 29th, 2026.

The event classification is determined by analyzing individual security events and their classifications.
-
Decisive True Positive - There is a high confidence that malicious activity has occurred with clear attack patterns.
-
Likely True Positive - There is strong evidence that malicious activity has occurred with some uncertainty.
-
Likely False Positive - There is an indication that the activity is likely benign with some suspicious elements.
-
Decisive False positive - There is a clear indication that a benign or authorized activity has occurred.
The confidence tag indicates the overall confidence of the event classification (High confidence, Medium confidence, or Low confidence) and it is based on the following factors:
-
Completeness - Measures the data availability and coverage.
-
Threat Intel quality - Assesses the quality and relevance of the threat intelligence available during the investigation.
-
True Positive Narrative - Assesses the strength of the evidence to support a malicious narrative.
-
False Positive Narrative - Assess the strength of the evidence to support a benign narrative.
The Overview tab displays the attack graph in the right pane. It provides a linear progression of the attack and a detailed view of the events from the Event Timeline to help users understand the relationships and progression of events that caused the incident to be promoted.
Note: The attack graph based on AI analysis is not available for incidents that were created prior to April 29th, 2026.

The nodes on the graph represent the devices, entities, and resources that the threat has targeted, as identified by one or more observables (see Graph Icon Descriptions for more information). The disposition icon is displayed on the left side of the node, if applicable. The relationship between nodes is shown on the label of the directional arrow that connects to other nodes. When there are multiple nodes that have been unified into one object and share a directional arrow, you can hover over one node to highlight the other nodes that have a relationship to it. Click a single node in the attack graph to open the Node drawer and view additional details of the selected asset or observable.
Click the icons to adjust how you want the graph to be displayed:
|
Icon |
Description |
|---|---|
|
|
Fit to View - Click this icon to recenter the graph within the pane. |
|
|
Rearrange - Click this icon to reflow the nodes and recenter the graph. |
|
|
Pan or Select - Click this icon to pan or drag an object (default), or to select or click an object. |
|
|
Layout - Changes the layout to one of the following options:
|
|
|
Back - Click this icon to highlight the graph with the previous event in the Event Timeline. Forward - Click this icon to highlight the graph with the next event in the Event Timeline. |
|
|
Back to start - Click this icon to remove the highlight in the graph and reset the right pane to the default attack graph. |
The Response tab in the incident detail view displays playbook details to assist in building effective incident response plans, processes, and procedures. Use the response tasks on this page to identify, contain, and eradicate the threat, and then restore systems to recover from the threat. Workflows are available for execution to automate some of the response tasks; notes are available to document your findings throughout the incident response process.
If applicable, the AI-generated recommended tasks displayed in the Identification phase (Device Analysis, User Analysis, and Detection Analysis) are marked with an AI-generated tag and are based on the analysis of the detections, logs, and observables in the incident. The priority tag (Critical, Important, or Optional) indicates the urgency based on the incident classification alignment.
The Lessons Learned phase includes tasks that improve the incident response process for future incidents and overall security posture. It highlights recommended actions for analysts and identifies potential gaps in the existing response tasks. Each task represents an activity that AI determined may be relevant to the incident but it could not match it to an existing response task. Click the task link to view AI-generated notes explaining why AI identified it as a potential gap.
For more information on playbook tasks, see the Response help topic.
The Worklog tab in the incident detail view displays a list of notes about the incident and the audit log of changes that have been made to the incident, including user feedback.
For details, see the Worklog help topic.
The Evidence tab in the incident detail view allows you to acquire and view forensic data from assets within an incident and connect to the assets using a remote shell for remediation purposes. Use the acquired data for further analysis and investigation in the XDR Forensics UI.
For more information, see the Evidence help topic.
The Report tab in the incident detail view displays AI-generated incident summary information that can be downloaded in a report format. This information can be edited and formatted in markdown, and then downloaded in a single file to your local computer. If something changes in the incident, the sections can be regenerated to get fresh AI-generated content and then, if necessary, edited and downloaded again to get an updated report file.
Note: The Incident Report data does not include data from the incident analysis generated by agentic AI.
For more information, see the Report help topic.