Incident Detail in Classic View
The Incident Detail (classic view) page provide more information about the incident to help you diagnose, contain, and remediate the threat. The page consists of the header, attack graph, and the following tabs: Overview, Detection, Response, Evidence, Worklog, and Report.
Note: The classic view is only displayed if the incident detail with AI analysis view is unavailable.
Click Launch AI analysis view in the upper right corner in incident detail to display the new AI-powered incident detail view. This view presents an overview of the AI analysis and evaluation of the incident, indicating whether it is likely a true or false positive threat. The Launch AI analysis view button is disabled for legacy incidents, including incidents that are directly promoted from Secure Cloud Analytics and incidents created using Cisco XDR APIs (for example, via an Automate workflow). For more information, see Incident Detail with AI Analysis. Click Classic view in the upper right corner to close the new view and return to the previous incident detail view.
Note: The AI analysis view is currently in Beta and subject to change.
 Incident Detail Header
In the header of the Incident Detail page, you can view the incident identification number, priority, status, name, which product reported it, date and time created, last activity, summary, who has been assigned to the incident, and the MITRE ATT&CK® tactics.
If the incident correlation process identifies the same correlated events between multiple incidents, the newer incidents will automatically merge into the older incident and a message is displayed below the incident description for all incidents to inform the user of the incident merge activity. If the status of a newer incident is New, the status is automatically changed to Closed: Merged once it is merged into the older incident. Incidents are updated as new events occur and if there are no additional common indicators found in 7 days, the newer incident will no longer be updated. A new incident is created if more correlated events and common indicators are seen after 7 days.
![Incident priority 850: Malicious payload executed by cmd[.]exe. Reported by Cisco XDR Analytics.](../Resources/Images/Incidents/incident-details-header.png "Click to enlarge")
From the incident header, you can perform the following tasks:
View Priority and Status
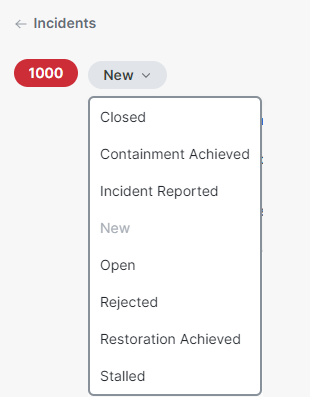
The incident priority (color-coded based on incident priority score) and the current status that has been assigned to the incident are shown in the upper portion of the header for immediate visibility.
To change the incident status, click the Status drop-down menu and choose a new status. See Available Statuses for more information.
View or Edit Incident Title and Summary
The incident title and summary are displayed prominently in the header to provide information about which product reported the incident and a timestamp for when it was reported. The AI-generated label is displayed at the end of the summary if the description was generated by AI. To display or hide the full summary, click the View more or View less link.
You can edit the incident title by click the  (Edit) icon at the end of the title when you hover over the title. To edit the summary, click Edit below the summary to open the Edit Summary dialog box. Enter your changes in markdown format and click Save when completed. Click Cancel to exit the Edit Summary dialog box. While editing the summary, If you navigate away from the text editor, the summary is automatically saved as a draft for the current browser tab only. The draft content is not available if the same session of Cisco XDR is opened in another browser tab. To restore the short description, return to the content and continue with your edits or click Undo or Use draft to remove or restore the draft content.
Note: The edit options is not available for AI generated incident name or summary.
View or Edit Detailed Description
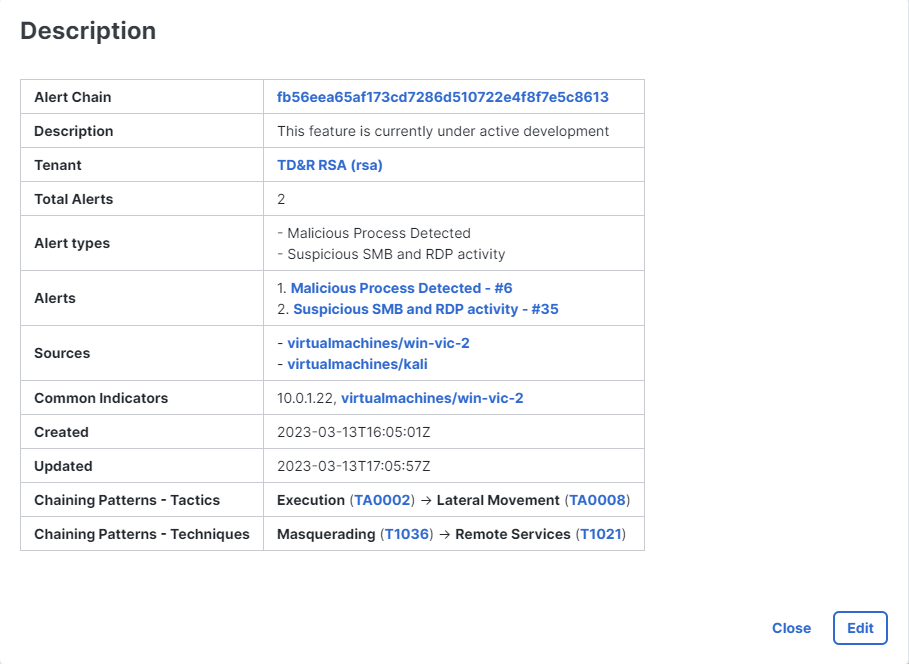
The View detailed description link is displayed just above the summary in the header. The detailed description provides a high-level description of the incident, including the source of the incident and the reason for promotion. The summary information varies depending on the reporting product. You can view and edit the Detailed description if the description was not generated by AI.
-
Click View detailed description in the header to open the Description dialog box.
-
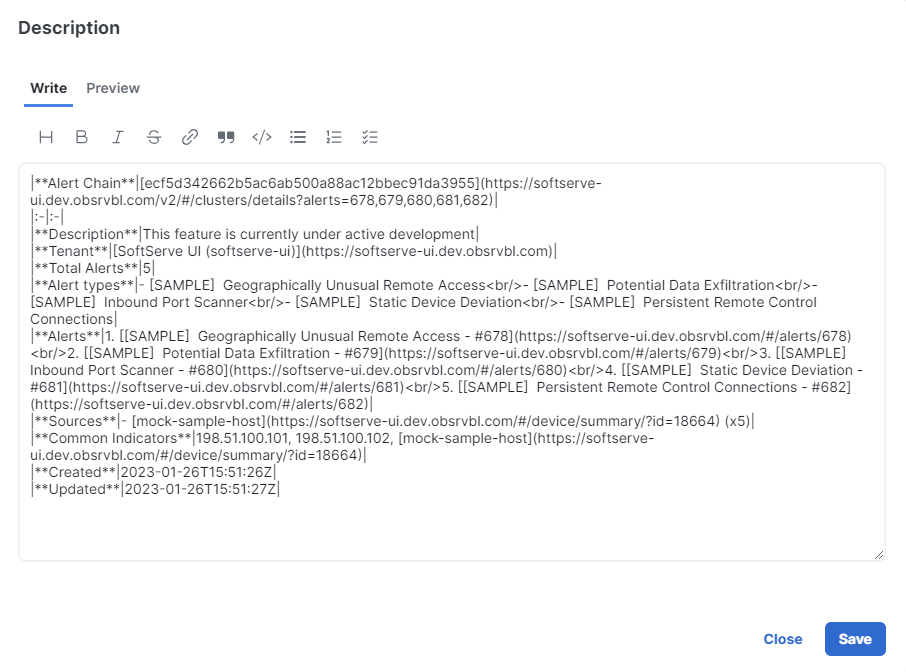
Click Edit to open the editor.
-
Enter your changes in markdown format. You can also use the options available in the formatting toolbar.
Note: If you navigate away from the text editor while editing, the description is automatically saved as a draft for the current browser tab only. The draft content is not available if the same session of Cisco XDR is opened in another browser tab. To restore the description, return to the text editor and continue with your edits or click Undo or Use draft to remove or restore the draft content.
-
Optionally, click the
 (Preview code) icon to view the modified description.
 -
Click Save to close the editor.
-
Click Close to exit the Description dialog box.
Note: The AI-generated label is displayed at the bottom of the Description dialog box and the Edit button is not available if the description was generated by AI.
View Linked Incidents or Unlink Incidents
The number of linked incidents is displayed beneath the incident title. Click Linked Incidents to open the Linked Incidents drawer and view the other incidents that are linked to the selected incident.
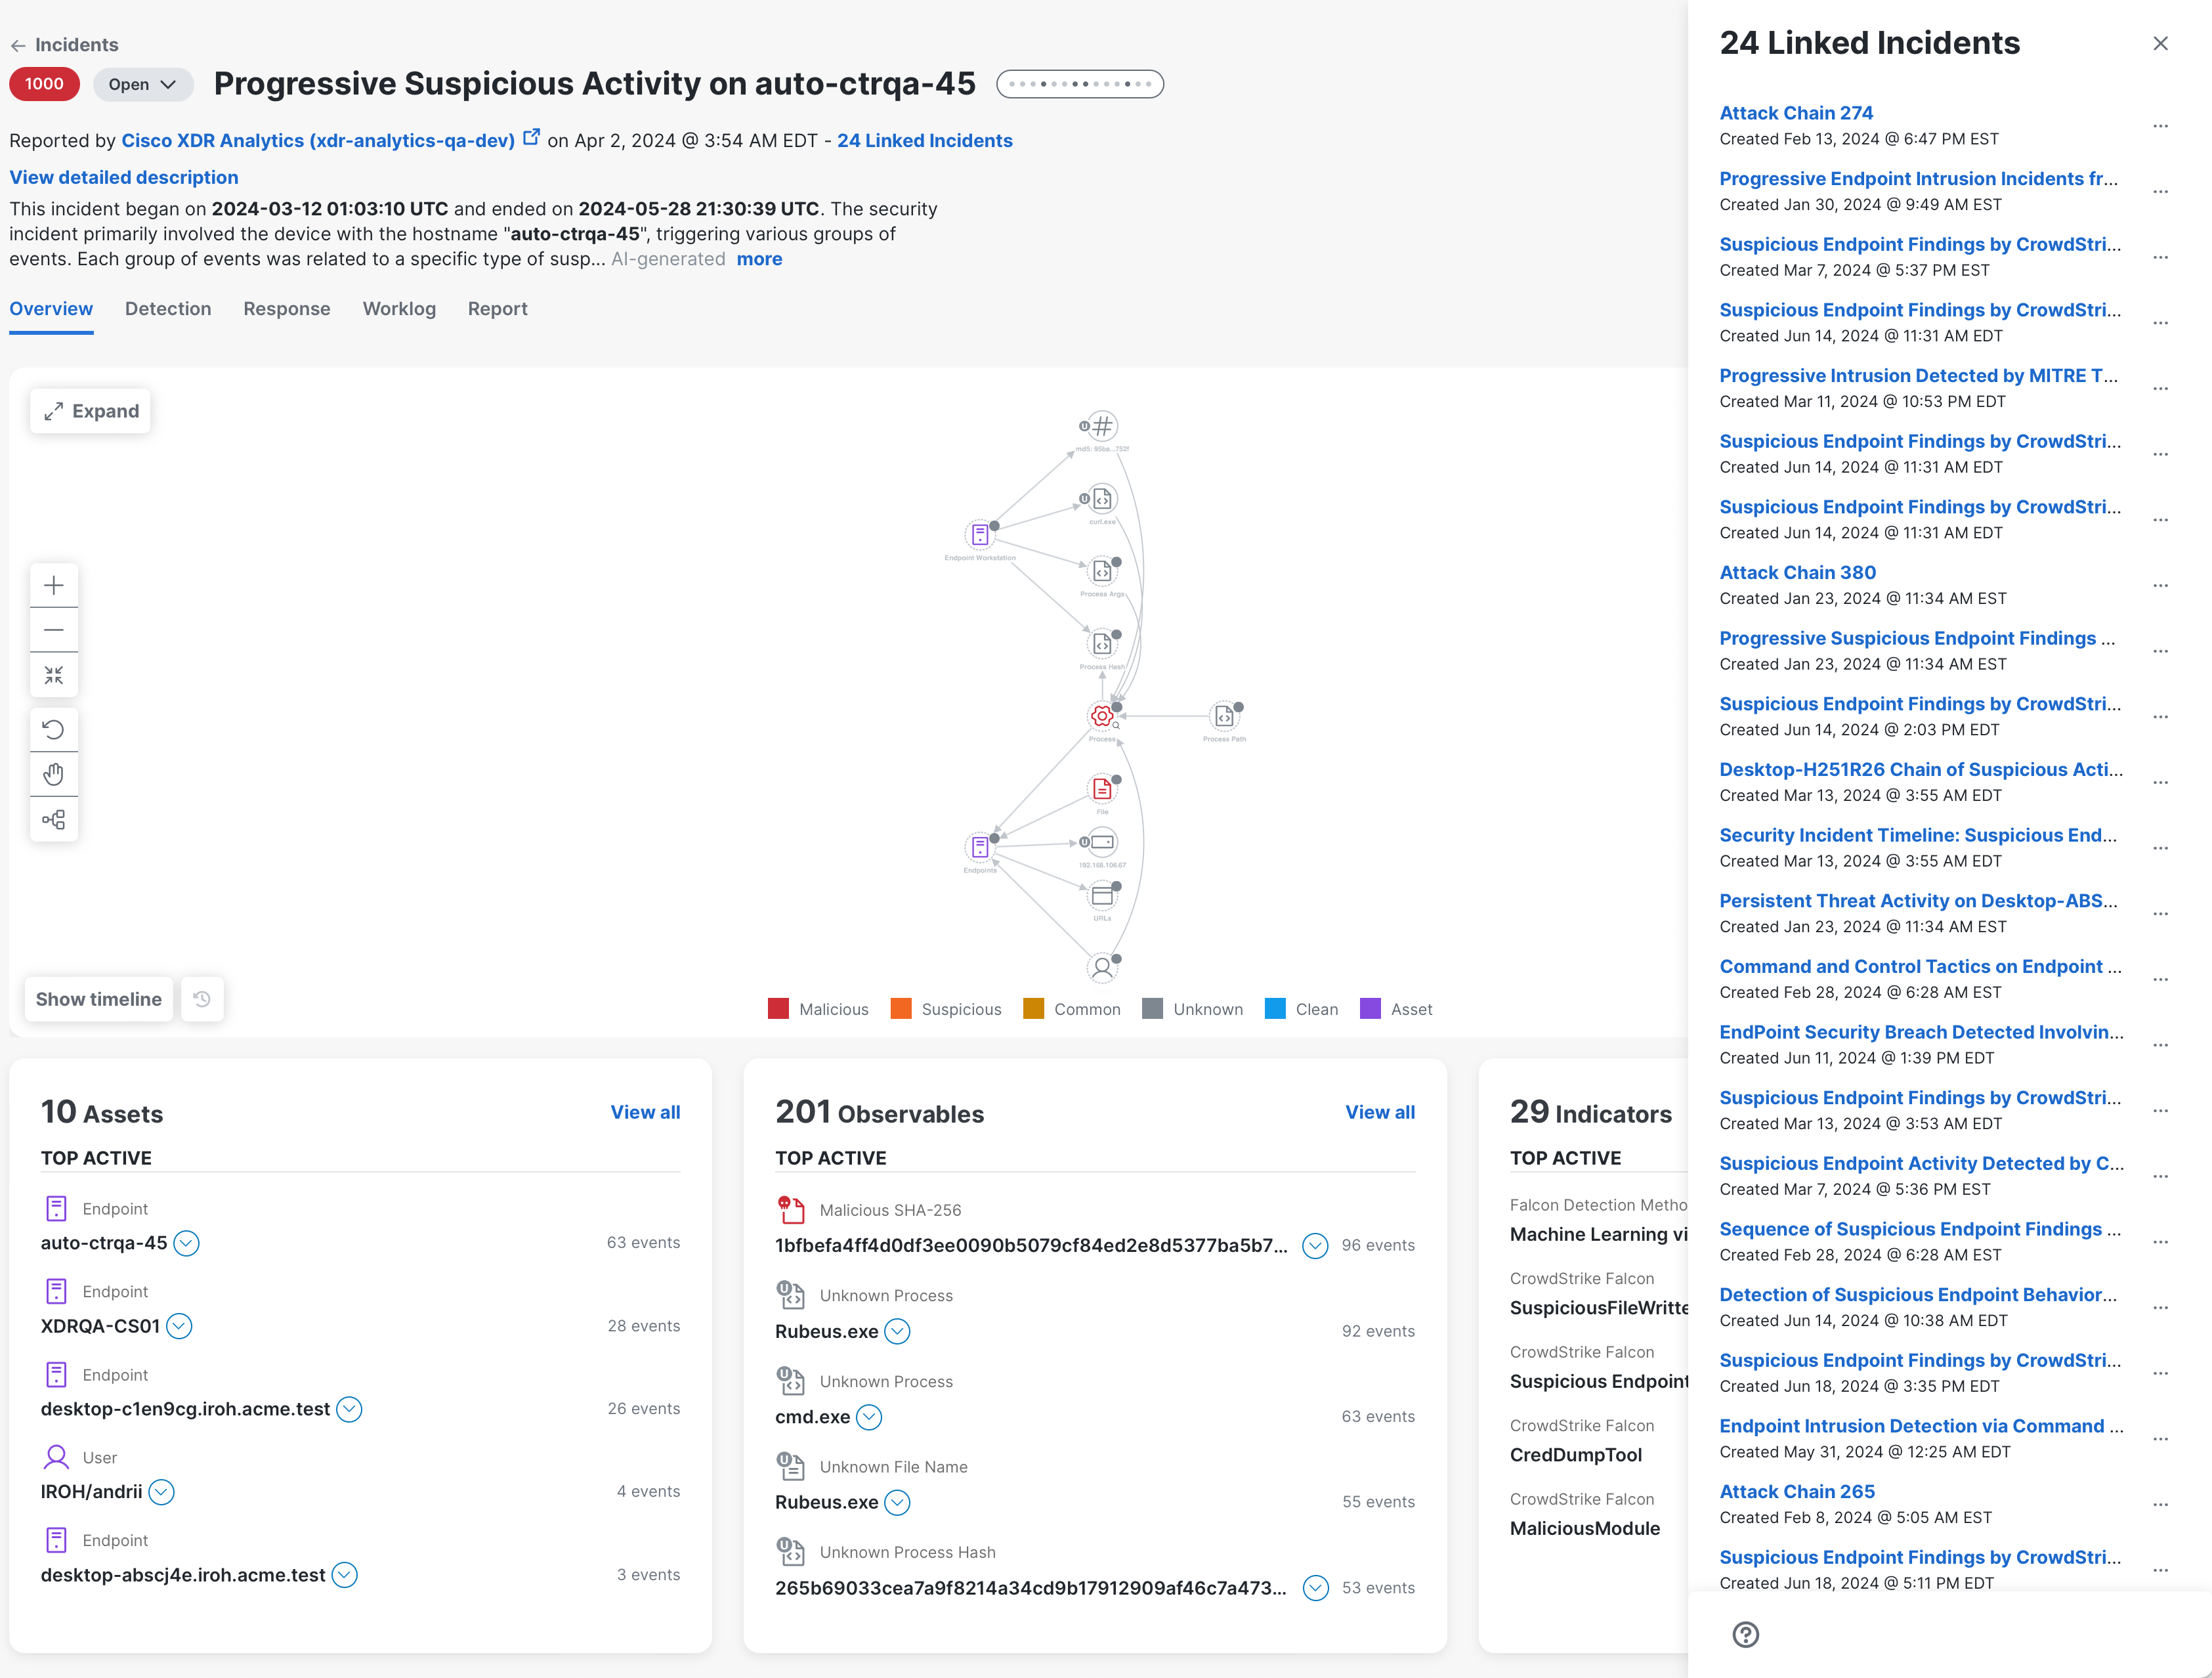
The Linked Incidents drawer displays the total number and list of incidents that are linked to the selected incident along with the date it was linked. Click the linked incident name to open the incident and view it in a new tab.
To unlink an incident, click the  (Ellipsis) icon next to the incident you want to unlink and choose Unlink from the drop-down menu. A message is displayed indicating the Incident was successfully unlinked and removes it from the drawer.
To close the drawer, click the 
View MITRE ATT&CK Tactics
The MITRE tactic tag shows the MITRE ATT&CK® tactics impacting the incident based on the Financial Risk Score, which indicates the probability of financial impact if the MITRE ATT&CK® patterns are not mitigated—the higher the score, the higher the probability of impact. If there are two or more tactics impacting the incident, the number of tactics is also displayed in the MITRE tactic tag.
Click the MITRE tactic tag to view the MITRE Tactic popup showing a list of specific MITRE ATT&CK tactics and techniques impacting the incident. The MITRE ATT&CK Coverage Map link opens the MITRE ATT&CK Coverage Map page. For details, see MITRE ATT&CK Coverage Map.
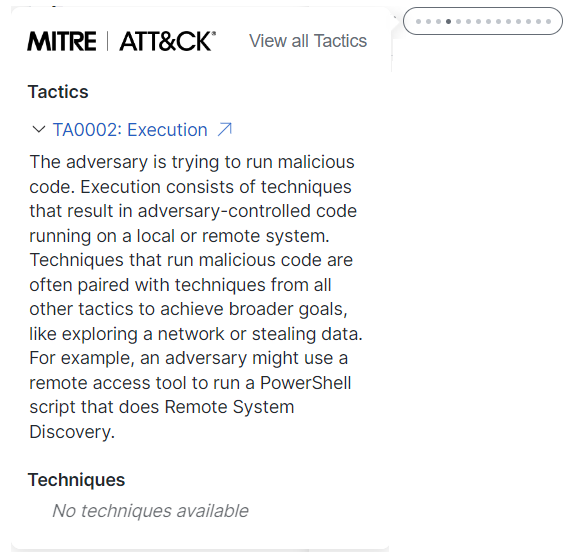
Click the  (Expand) icon to view all the techniques for each tactic listed. Click the
  (New Tab) icon next to the tactic name to view the tactic details on the MITRE ATT&CK Enterprise Tactics page in a new tab and the technique link displays the technique details on the MITRE ATT&CK Enterprise Techniques page in a new tab.
Click View events to view all events related to the incident on the Detections tab in the incident detail. For details, see Detection.
Assign Incident
You can assign or unassign users from the Assigned field in the upper right corner of the header. When the incident is assigned, an avatar with the user's initials is displayed and you can hover over the avatar to view the user's full name in a tooltip.
Note: If a user with an Incident Responder or Security Analyst role navigates to the Incident Detail page for an incident that is Unassigned and has a status of New, the incident is automatically assigned to the current user and the status is changed to Open.
For more information on assigning users to an incident, see Assign Incident.
Share Incident
When an incident is selected, a URL is generated in the browser address bar that you can copy and share the incident with others. In addition, if you click a tab on the Incident Detail page, the tab name is appended to the URL.
Overview
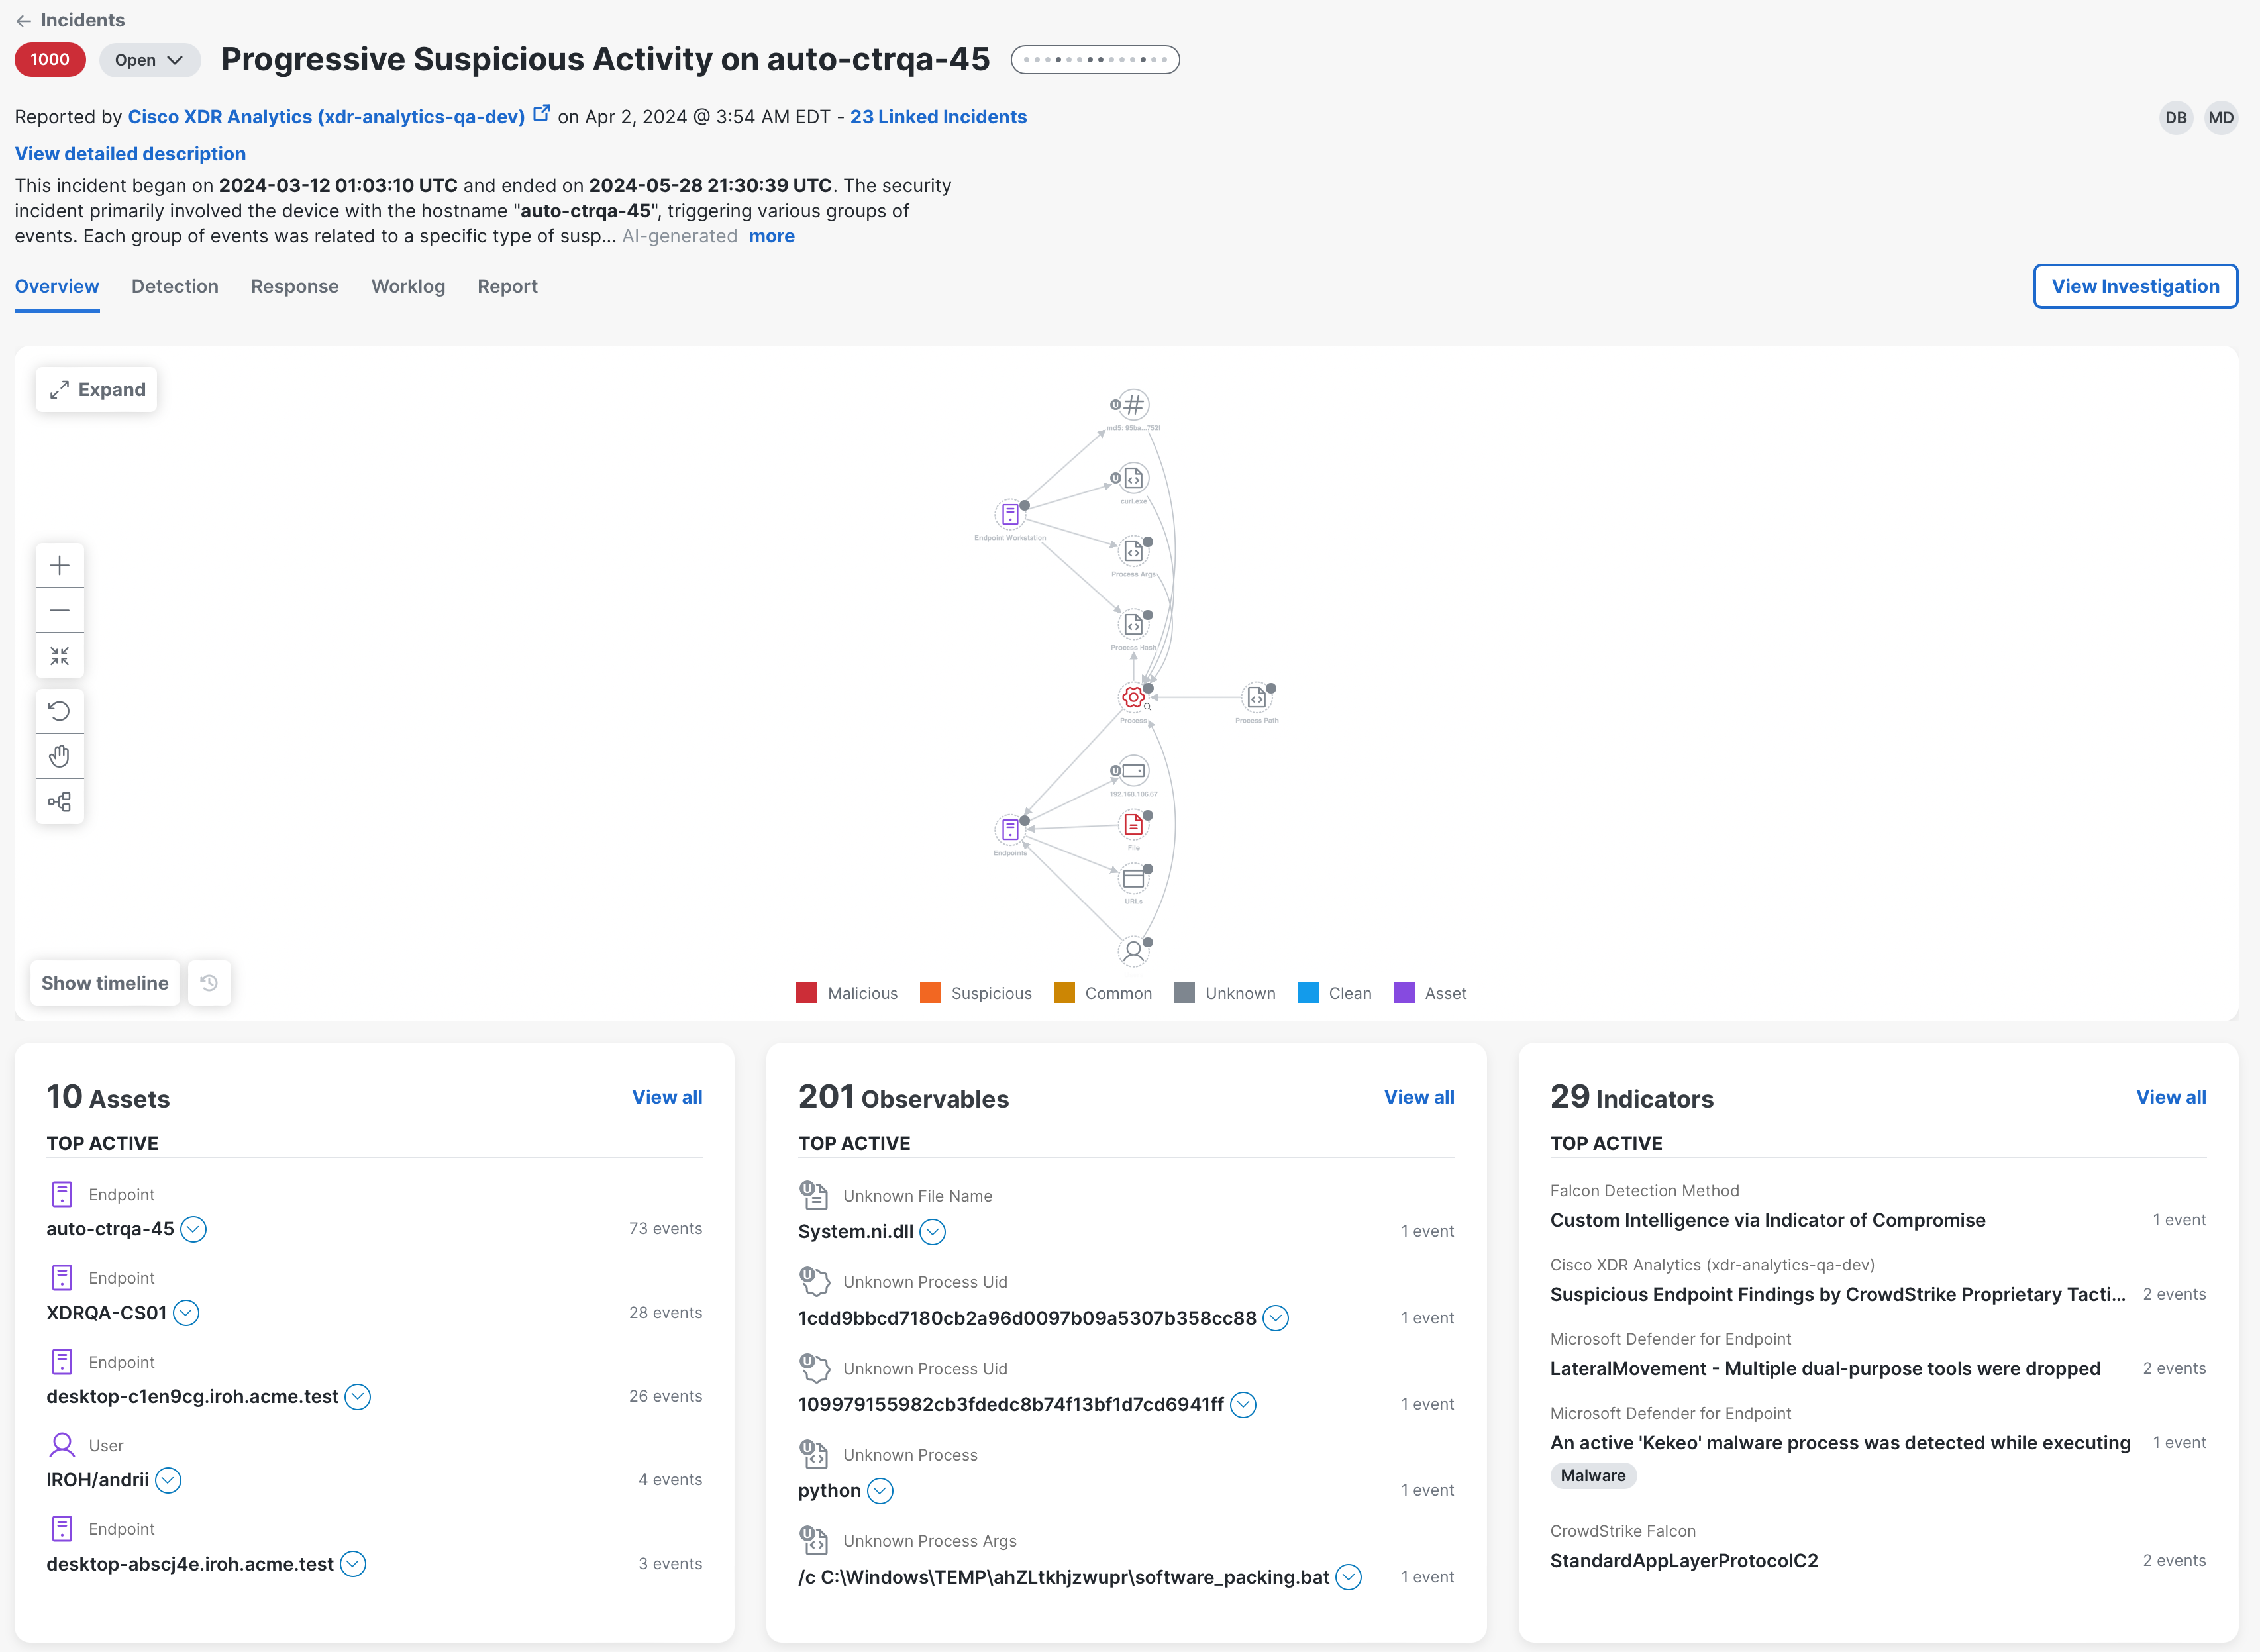
The Overview tab in the incident detail provides an attack graph in the upper portion of the page and overall metric counts of the most important data within the selected incident in the metric cards in the lower portion of the page.
The attack graph displays a compacted relationship view of the investigation of events that caused the incident to be promoted. This view provides a linear progression of the attack at a high level. The Timeline panel beneath the attack graph displays a color-coded timeline (based on disposition) of the volume of events at different points in time.
The metric cards in the lower portion of the page provide a summary of the top active assets, observables, and indicators to help you quickly understand the incident from one view. The metrics are based on the total number of events for the selected incident. Open the drawer on each card to view all assets, observables, and indicators associated with the incident, and to view in the investigation.
View Attack Graph
The attack graph in the upper portion of the Overview tab displays a compacted relationship view of the investigation of events that caused the incident to be promoted. This view provides a linear progression of the attack at a high level.
Note: If the graph has reached its maximum load limit, the graph will not load and a message is displayed. You can continue to access other incident details.
The nodes on the graph represent the devices, entities, and resources that the threat has targeted, as identified by one or more observables (see Graph Icon Descriptions for more information). When targets and observables have the same strong identifier and relationship, they are unified into one node to simplify the view and reduce the noise on the graph. The badge on the node displays the number of objects that have been unified and the disposition icon is displayed on the left side of the node, if applicable. For details, see Color and Icon Key. The  (Actions Taken) icon on the right side of the node indicates that remedial actions have been executed by the integrated Endpoint Detection and Response (EDR) source for the device.
The relationship between nodes is shown on the label of the directional arrow that connects to other nodes. When there are multiple nodes that have been unified into one object and share a directional arrow, you can hover over one node to highlight the other nodes that have a relationship to it.
Right-click a node on the graph to open the Pivot menu that enables you to take action on the node. You can perform some actions directly in the Pivot menu or pivot to the integrated product to perform additional actions. If the nodes are grouped, double-click the grouped node to expand it and then right-click a node to open the Pivot menu.
Graph Controls
Click the icons to adjust how you want the graph to be displayed:
|
Icon |
Description |
|---|---|
|
|
Expand/Collapse - Click this icon to expand or collapse the Attack Graph panel. |
|
|
Zoom in - Click this icon to decrease the view of information within the panel. |
|
|
Zoom out - Click this icon to enlarge the information within the panel. |
|
|
Fit to View - Click this icon to recenter the graph within the panel when the panel is expanded to full screen. |
|
|
Rearrange - Click this icon to reflow the nodes and recenter the graph. |
|
|
Pan or Select - Click this icon to pan or drag an object (default), or to select or click an object. |
|
|
Layout - Changes the layout to one of the following options:
|
|
|
Group/Ungroup - Click these icons to group or ungroup the nodes on the graph based on node conditions, node count, and user selection. The nodes are grouped by default when the node count is 2 or higher. Nodes that have identical type, email related activities for senders and recipients, and nodes with no relations can be grouped. See Group Nodes for more information. |


 Attack Graph Node Drawer
Click a single node in the Attack Graph panel to open the Node drawer and view additional details of the selected asset or observable. If the node is grouped, expand the group and click a single node.
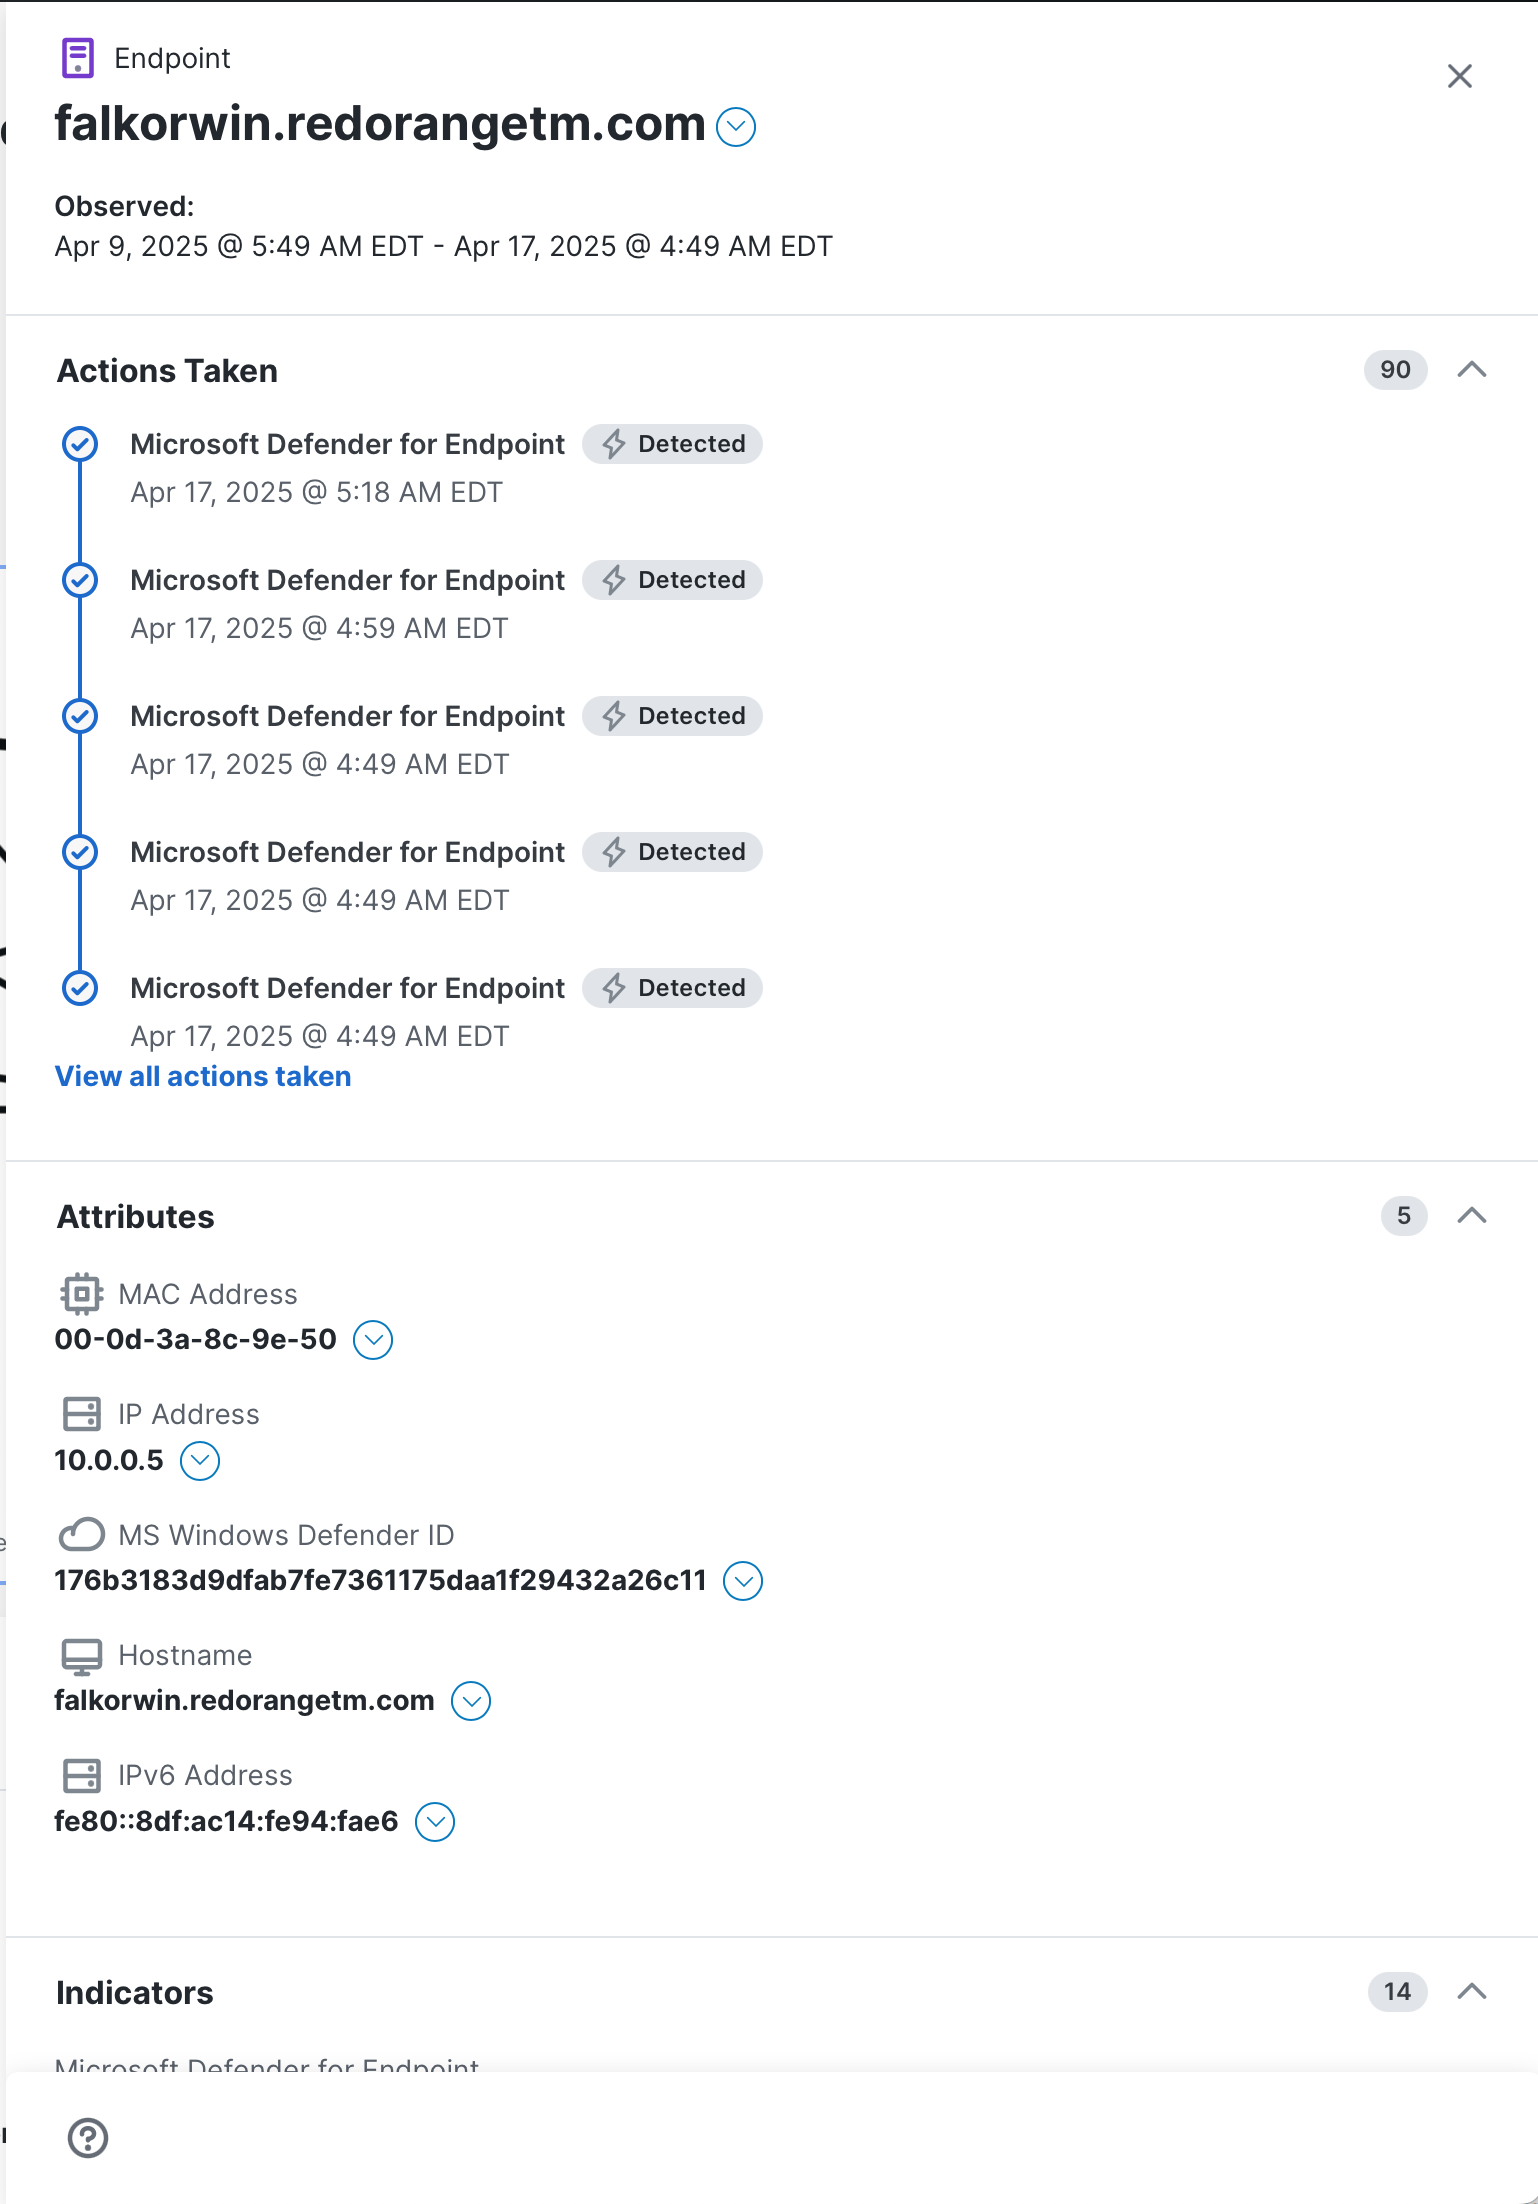
If the device or person is in Cisco XDR Assets, then a View in Devices link or View in Users will be displayed in the upper portion of the drawer. Click the link to open and view the details in Assets.
Actions Taken
If applicable, the Actions Taken panel in the node drawer displays the remedial actions that have been executed by the integrated Endpoint Detection and Response (EDR) source and actions executed by Automation workflows for the selected node. These actions involve proactive measures, such as blocking or quarantining to manage and mitigate identified threats or security incidents, and these actions also display observable data, if available. The badges to the right of the source indicate the action taken and the reason for the failure, if applicable. If there are more than 50 actions taken, all identical actions will be aggregated into one action with the action count displayed as a badge to the left of the source.
The list of actions is sorted by latest to oldest. If there are six or more actions taken, the View all actions taken link is displayed and it opens another drawer with a complete list of all the actions taken for the node. Use the Source and Action drop-down lists in the upper portion of the Actions Taken drawer to narrow the list of all the actions taken and only show those actions that match the filters you have selected. Click the  (Clear) icon to remove your selections.
Group Nodes
If the node count is 2 or higher and there are nodes with the same type, disposition, and have the same relationship to the same set of observables, they are grouped by default to reduce the noise on the graph. The grouping capability compresses multiple like nodes into one node on the graph.
You can also turn on or turn off the grouping capability using the  (Group) icon and
  (Ungroup) icon i in the Graph Controls on the Attack Graph.
-
Click the
(Group) icon to compress multiple nodes into one node. -
Click the
(Ungroup) icon to show all nodes on the graph.
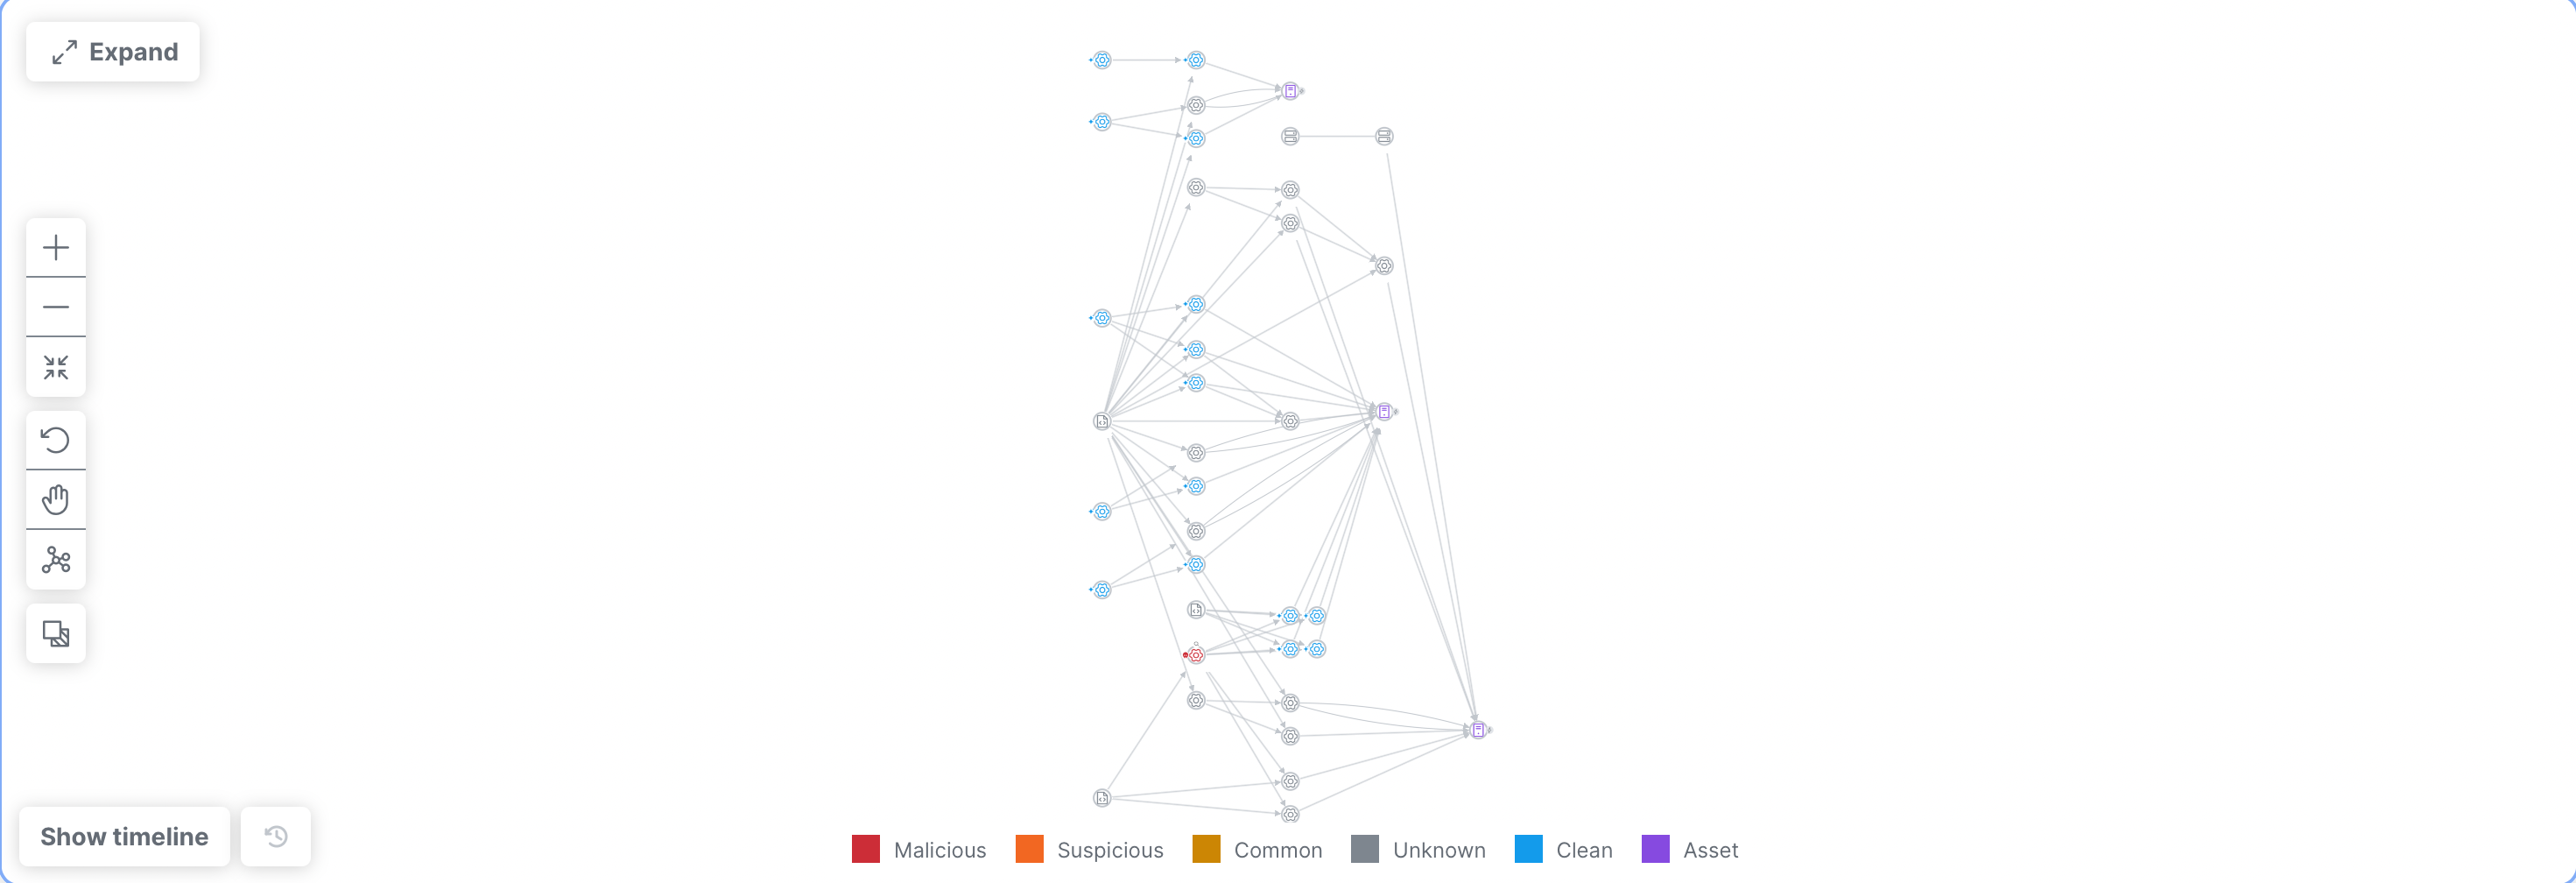 Grouped Nodes
When nodes are grouped, the edge is a dotted circle, with a badge that indicates the number of nodes in the group.
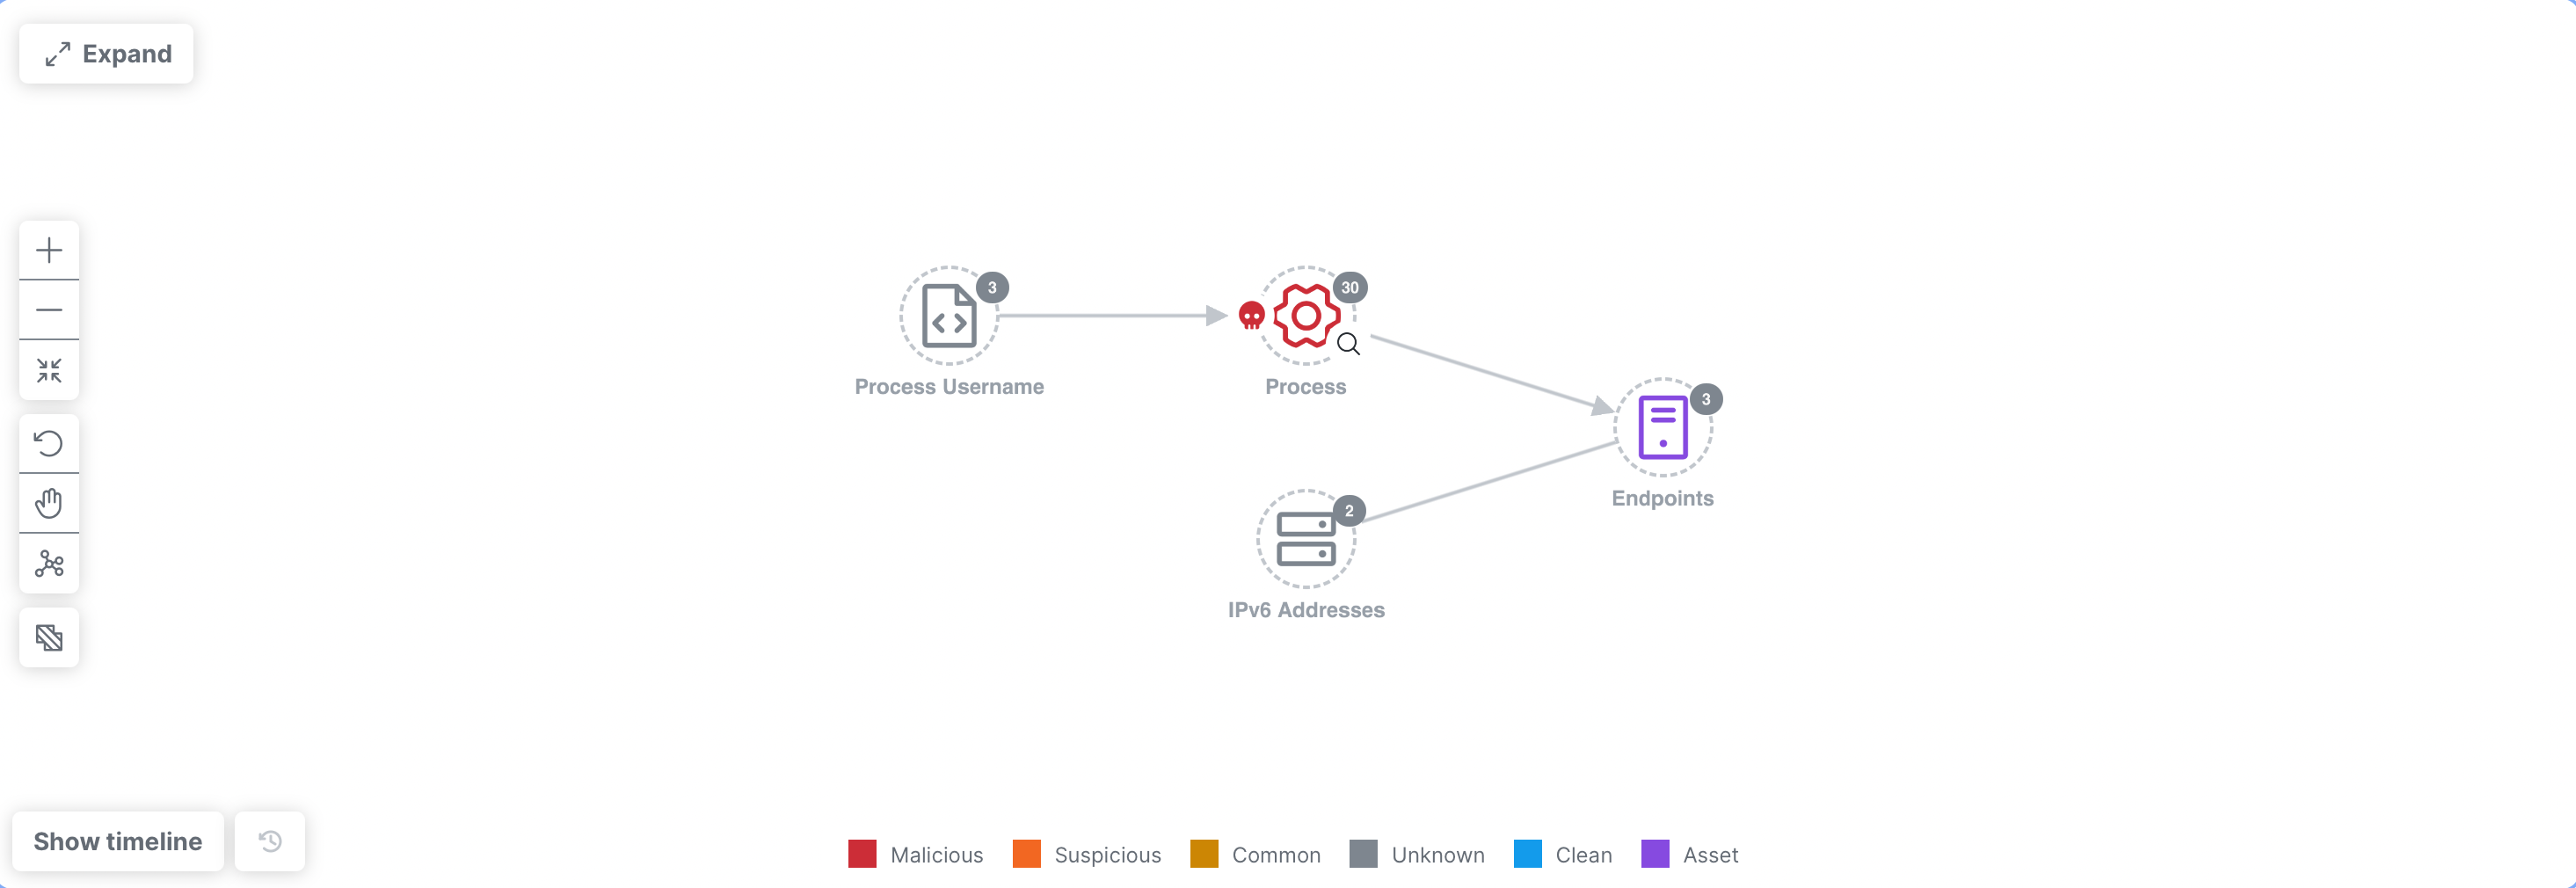
In this example, these nodes were grouped because they are of the same observable type and have the same relationship (connected to) another observable.
Click the (Ungroup) icon to ungroup the nodes and return to the original view.
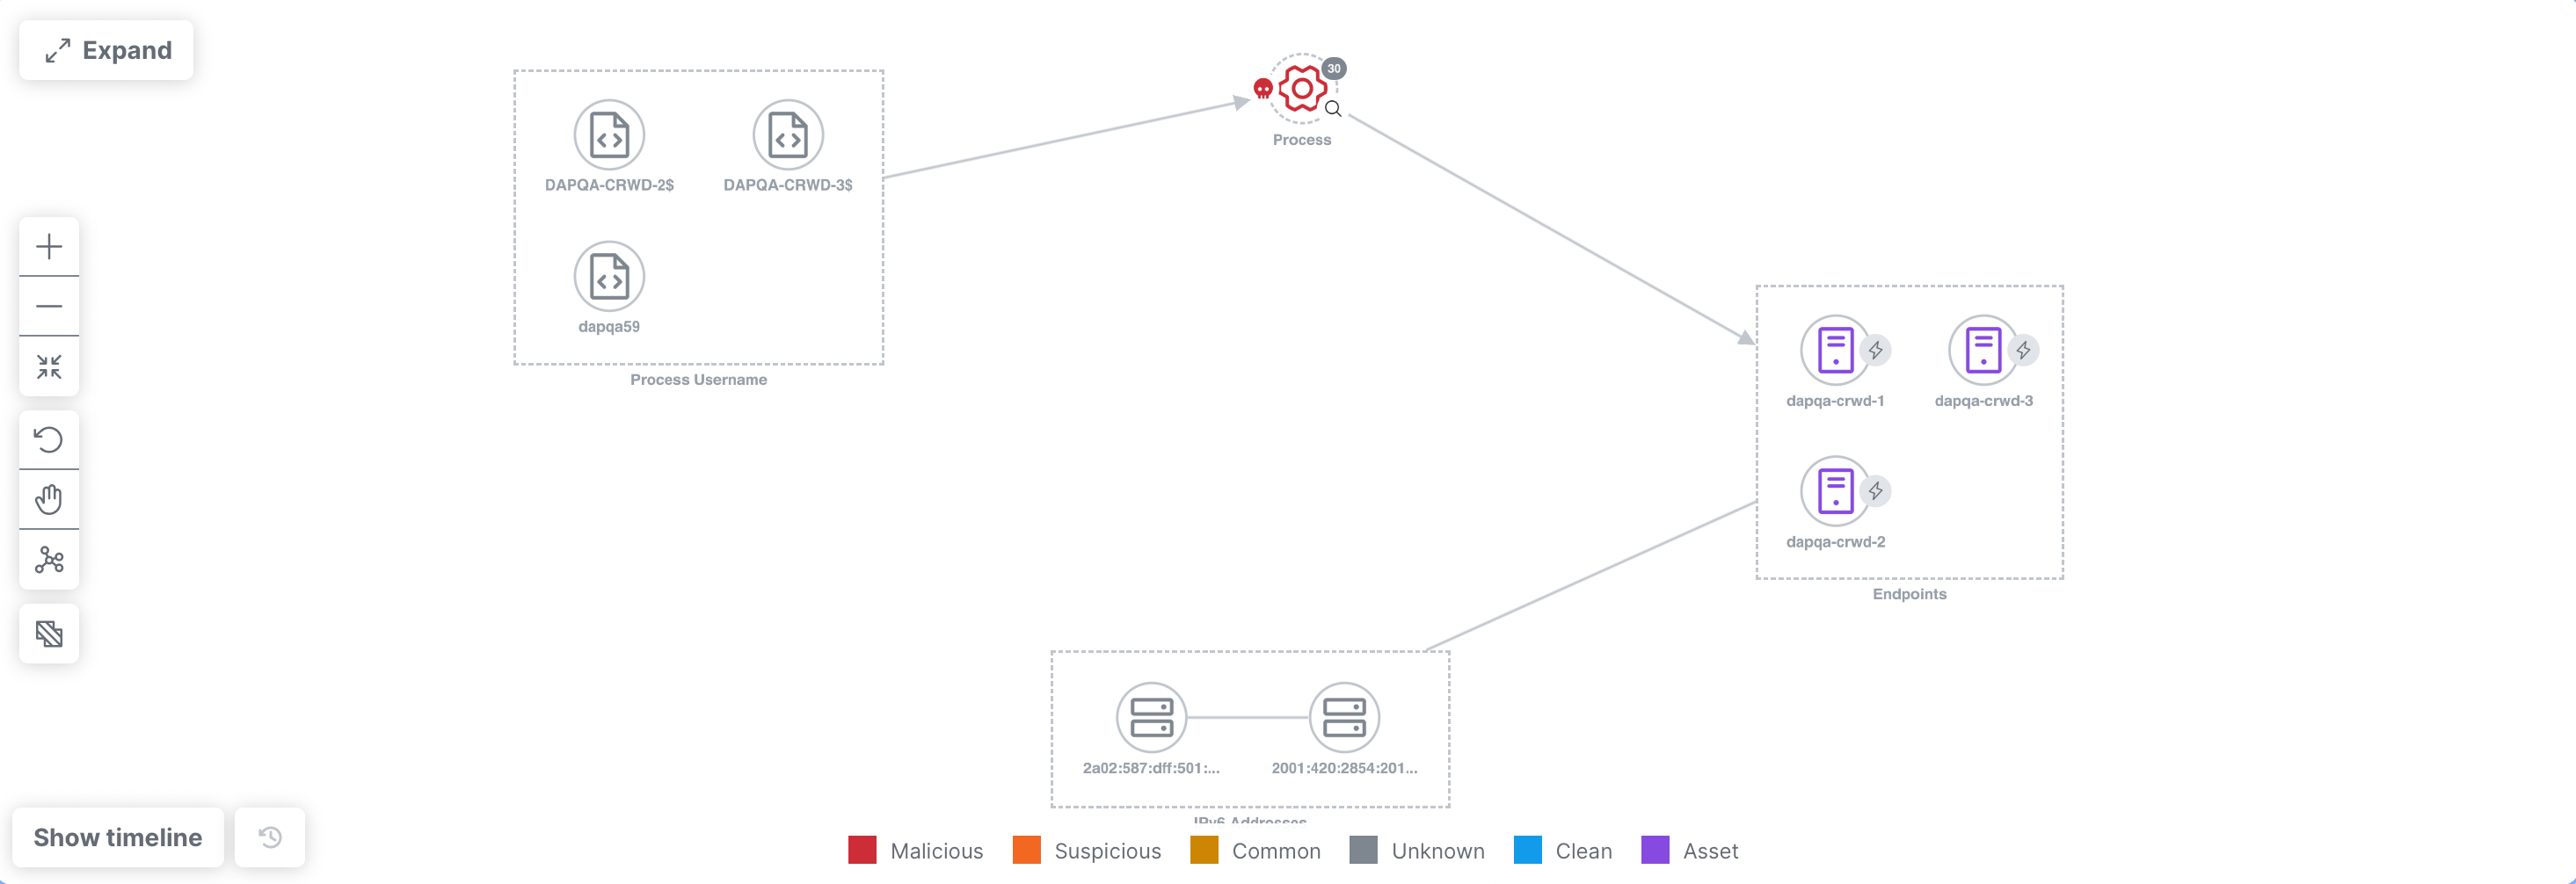
Expanded Grouped Node
Double-click the grouped node to expand it and view all the nodes contained in the group. Click any node in the group to open the Node drawer and view more information.
Timeline
The Timeline panel beneath the Attack Graph panel displays a color-coded timeline (based on disposition) of the volume of events at different points in time. The Timeline panel is collapsed by default and you can expand the panel by clicking the Show timeline button.

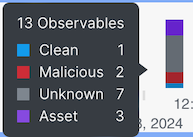
Hover any point on the timeline to open a tooltip that shows the total number of observables and assets and the disposition relevant to all events that started at that specific time.
Move the side handles on the timeline to zoom in on a specific event or zoom out. When you zoom in on the event, it also narrows the display of nodes on the graph to reflect the selection in the timeline.
To refresh the timeline, click the  (Timeline Refresh) icon.
View Top Assets
The Assets card displays the total number of unique assets from all of the events related to the selected incident and the top five unique assets with the most events. The number of events where each asset was sighted is also shown. The assets are represented by an icon that allows you to easily distinguish the asset type.
Each asset includes a  (Pivot Menu) icon that enables you to take action on it. You can perform some actions directly in the Pivot menu or pivot to the integrated product to perform additional actions.
View All Assets
Click View all to open the Assets drawer where you can view the full list of assets associated with the incident. Use the Search bar in the upper portion of the drawer to quickly search the list of assets. The assets can be sorted alphabetically or in ascending or descending order using the  (Sort) icon in the column header.
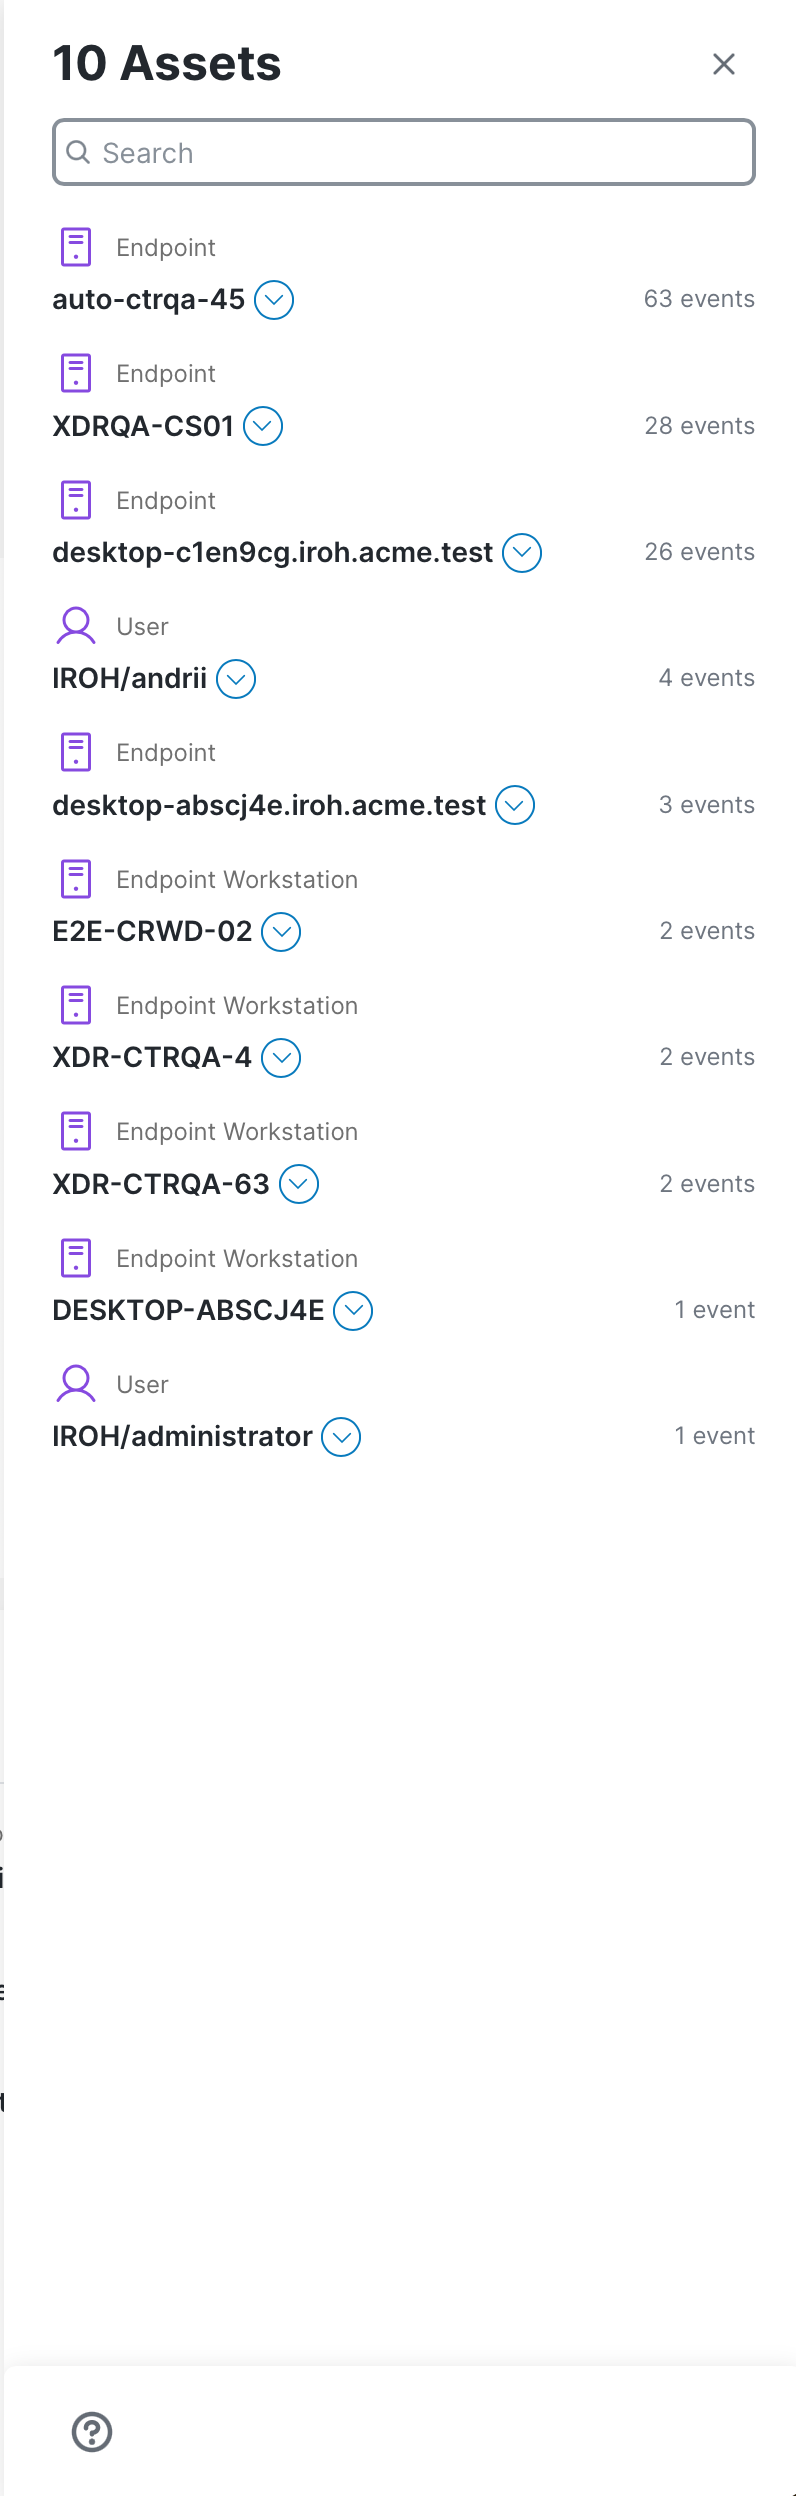
Click the (Pivot Menu) icon to choose the attribute associated with the asset, and then choose Investigate observable to investigate it. For more information, see Pivot Menu.
View Top Observables
The Observables card displays the total number of unique observables from all of the events related to the incident. It includes the top five unique observables with the most events, the color-coded disposition of the observable, the event count for each observable, and the observable identifier and type. The observable is represented by a color-coded icon that allows you to easily distinguish the observable type.
Each observable includes a (Pivot Menu) icon that enables you to take action on it. You can perform some actions directly in the Pivot menu or pivot to the integrated product to perform additional actions. For more information, see Pivot Menu.
View All Observables
Click View all to open the Observables drawer where you can view the full list of observables associated with the incident and start a new investigation for selected observables in a new tab.
Use the Search bar in the upper portion of the drawer to quickly search the list of observables.
From the Disposition drop-down list, check the check boxes next to the disposition values to narrow the display based on disposition. If you do not choose a disposition, all observables with all dispositions are displayed in the list. Click the (Clear) icon to remove your selections.
From the Type drop-down list, check the check boxes next to the data type values to narrow down the display based on data type. If you do not choose a data type, all observables with all data types are displayed in the list. Click the (Clear) icon to remove your selections.
The observables can be sorted alphabetically or in ascending or descending order using the (Sort) icon in the column header.
Check the check boxes next to the observables and click Investigate observables to start a new investigation for the selected observables in a new tab. For more information, see Pivot Menu. If there are more than 200 observables, you can click Select first 200 to check the check boxes next to the first 200 observables listed in the drawer. Otherwise, click Select all to check the check boxes next to all the observables.
Click the (Pivot Menu) icon to view the total number of verdicts for the observable and the source of the verdict with the highest priority disposition. Expand the section to view all the verdicts, their source, disposition, and when they were created and will expire. You can also choose Investigate observable in the Pivot menu to investigate it. For more information, see Pivot Menu.
Click the
View Top Indicators
The Indicators card displays the total number of unique indicators from all events related to the incident. It includes the top five unique indicators (producer) with the most events and the event count for each indicator.
View All Indicators
Click View all to open the Indicators drawer where you can view the full list of indicators associated with the incident, along with the number of events where the indicators were seen. Use the Search bar in the upper portion of the drawer to quickly search the list of indicators. The indicators can be sorted alphabetically or in ascending or descending order using the (Sort) icon in the column header.
Click the
Detection
The Detection tab in the incident detail (classic view) displays data associated with the incident that is derived from security events, judgments, and indicators.
Security events generated by integrated products are analyzed by the correlation engine in Cisco XDR to determine the relationships between detections, such as shared observables, overlapping timelines, and related attack patterns. When events are determined to be part of the same threat, they are grouped to create incidents in Cisco XDR. The resulting data is displayed in the Detection tab. For more information on security events, see Detections.
You can filter the types of events to narrow the list of results in the table.
Each row in the table includes data from an event that was initially involved with the incident, or events and indicators included in the saved investigations that are linked to the incident.
Detection Table Column Descriptions
|
Column Name |
Description |
|---|---|
|
First Seen |
Date and time of the first detection in an event created by the source. The events are sorted by timestamp and you can choose to sort newest to oldest (ascending) or oldest to newest (descending) using the |
|
Severity |
The threat level given to the event (Critical, High, Medium, Low, None, Unknown, Info). You can sort the events by highest to lowest severity (Descending) or lowest to highest severity (Ascending) using the sort icon in the column heading. |
|
Source |
Cisco XDR integration or source that produced the event. Click the Source link to open the event in the originating product. You can sort the sources alphabetically using the sort icon in the column heading. |
|
Indicators |
List of indicators the event is related to via a event-of relationship. |
|
Observables |
The first three observables that were contained in the event, and dispositions of the observables taken from verdicts. The observables are color-coded and sorted based on the disposition. If more than three observables were seen in the event, the number of additional observables is displayed in the + more link beneath the list. Click the + more link to open the Observables drawer and view all the observables seen in the event. Use the Search bar in the upper portion of the drawer to quickly search the list of observables and use the Disposition or Type drop-down list and check the check boxes next to the disposition or observable type values to narrow the display based on disposition or observable type. If you do not choose a disposition or type, all observables with all dispositions and types are displayed in the list. Click the
Click the |
|
Assets |
The assets that were targeted in the event; where the displayed asset values are based on strong identifier types. The assets are color-coded based the asset type. Click the |
|
Last Seen |
Date and time of the latest detection in an event created by the source. The events are sorted by timestamp and you can choose to sort newest to oldest (ascending) or oldest to newest (descending) using the This is an optional column that is only available in the Table settings drawer. For details, see Customize Columns. |
|
Name |
Name of the event defined by the source. This is an optional column that is only available in the Table settings drawer. For details, see Customize Columns. |
 Filter Events
You can filter the events by type, source, and severity to narrow the list of results in the table. By default, all the events are displayed.
Filter by Type
Click the Type drop-down list and choose which events you want displayed in the list. When multiple types are selected, the number of selections is displayed on the label. Click the (Clear) icon to remove your selections.
Filter by Source
The Source menu allows you filter through events that were promoted from specific integrations.
Click the Source drop-down menu and check the check boxes next to the integrations that promoted the events. When multiple integrations are selected, the number of selections is displayed on the label. Click the (Clear) icon to remove your selections.
If the event contains 5 or more integrations, a Search bar is visible to enable you to narrow the filter options even further.
Filter by Severity
The Severity menu allows you display events based on the severity level (Critical, High, Medium, Low, None, Unknown, Info).
Click the Severity drop-down menu and choose the severity level of the events and indicators that you want displayed in the list. When multiple severities are selected, the number of selections is displayed on the label. Click the (Clear) icon to remove your selections.
Reorder and Customize Columns
You can reorder the columns in the table and select the columns displayed to customize the table for the data you want to view.
To reorder the table columns, click and drag a column header to the desired position in the table.
To customize the columns, click the  (Settings) to open the Display Settings drawer and check the check boxes next to the columns you want displayed in the events table. If custom columns are displayed, click Reset to defaults to reset the table column settings to its default values.
Download Events
Click Download JSON in the upper right corner of the Detection tab to download all the events in the detections table in JSON format.
View Summary of Event in Drawer
When you click an event in the list, the Event drawer opens where you can quickly view the details of the event.
Response
The Response tab in the incident detail displays a playbook template to assist in building effective incident response plans, processes, and procedures. Use the response tasks on this page to identify, contain, and eradicate the threat, and then restore systems to recover from the threat. Workflows are available for execution to automate some of the response tasks; notes are available to document your findings throughout the incident response process.
For more information, see the Response Tasks help topic.
Forensics
The Forensics tab in incident detail allows you to acquire and view forensic data from assets within an incident and connect to the assets using a remote shell for remediation purposes. Use the acquired data for further analysis and investigation in the XDR Forensics UI.
For more information, see the Forensics help topic.
Worklog
The Worklog tab in the incident detail is used to enter notes about the findings while investigating the incident and to view the audit log of changes that have been made to the incident. By default, all events are displayed.
For more information, see the Worklog help topic.
Report
The Report tab in the incident detail displays AI-generated incident summary information that can be downloaded in a report format. This information can be edited and formatted in markdown, and then downloaded in a single file to your local computer. If something changes in the incident, the sections can be regenerated to get fresh AI-generated content and then, if necessary, edited and downloaded again to get an updated report file.
For more information, see the Report help topic.