Evidence
Note: The XDR Forensics feature requires Cisco XDR Advantage or Cisco XDR Premier licensing tier.
The Evidence tab in incident detail allows you to acquire and view forensic data from assets within an incident and connect to the assets using a remote shell for remediation purposes. The data varies based on the asset and the acquired data can be used for further analysis and investigation in the XDR Forensics UI. For more information, see XDR Forensics.
Note: Prior to acquiring forensic evidence for an incident, ensure that you have a Secure Client deployment with the XDR Forensics module enabled and installed on your endpoints. For more information, see Create Deployment. Otherwise, a message is displayed on the Evidence tab requesting that you must enable XDR Forensics in your Client Management deployments before you can acquire forensic evidence.
To acquire forensic evidence:
-
Navigate to the incident detail and click the Evidence tab.
-
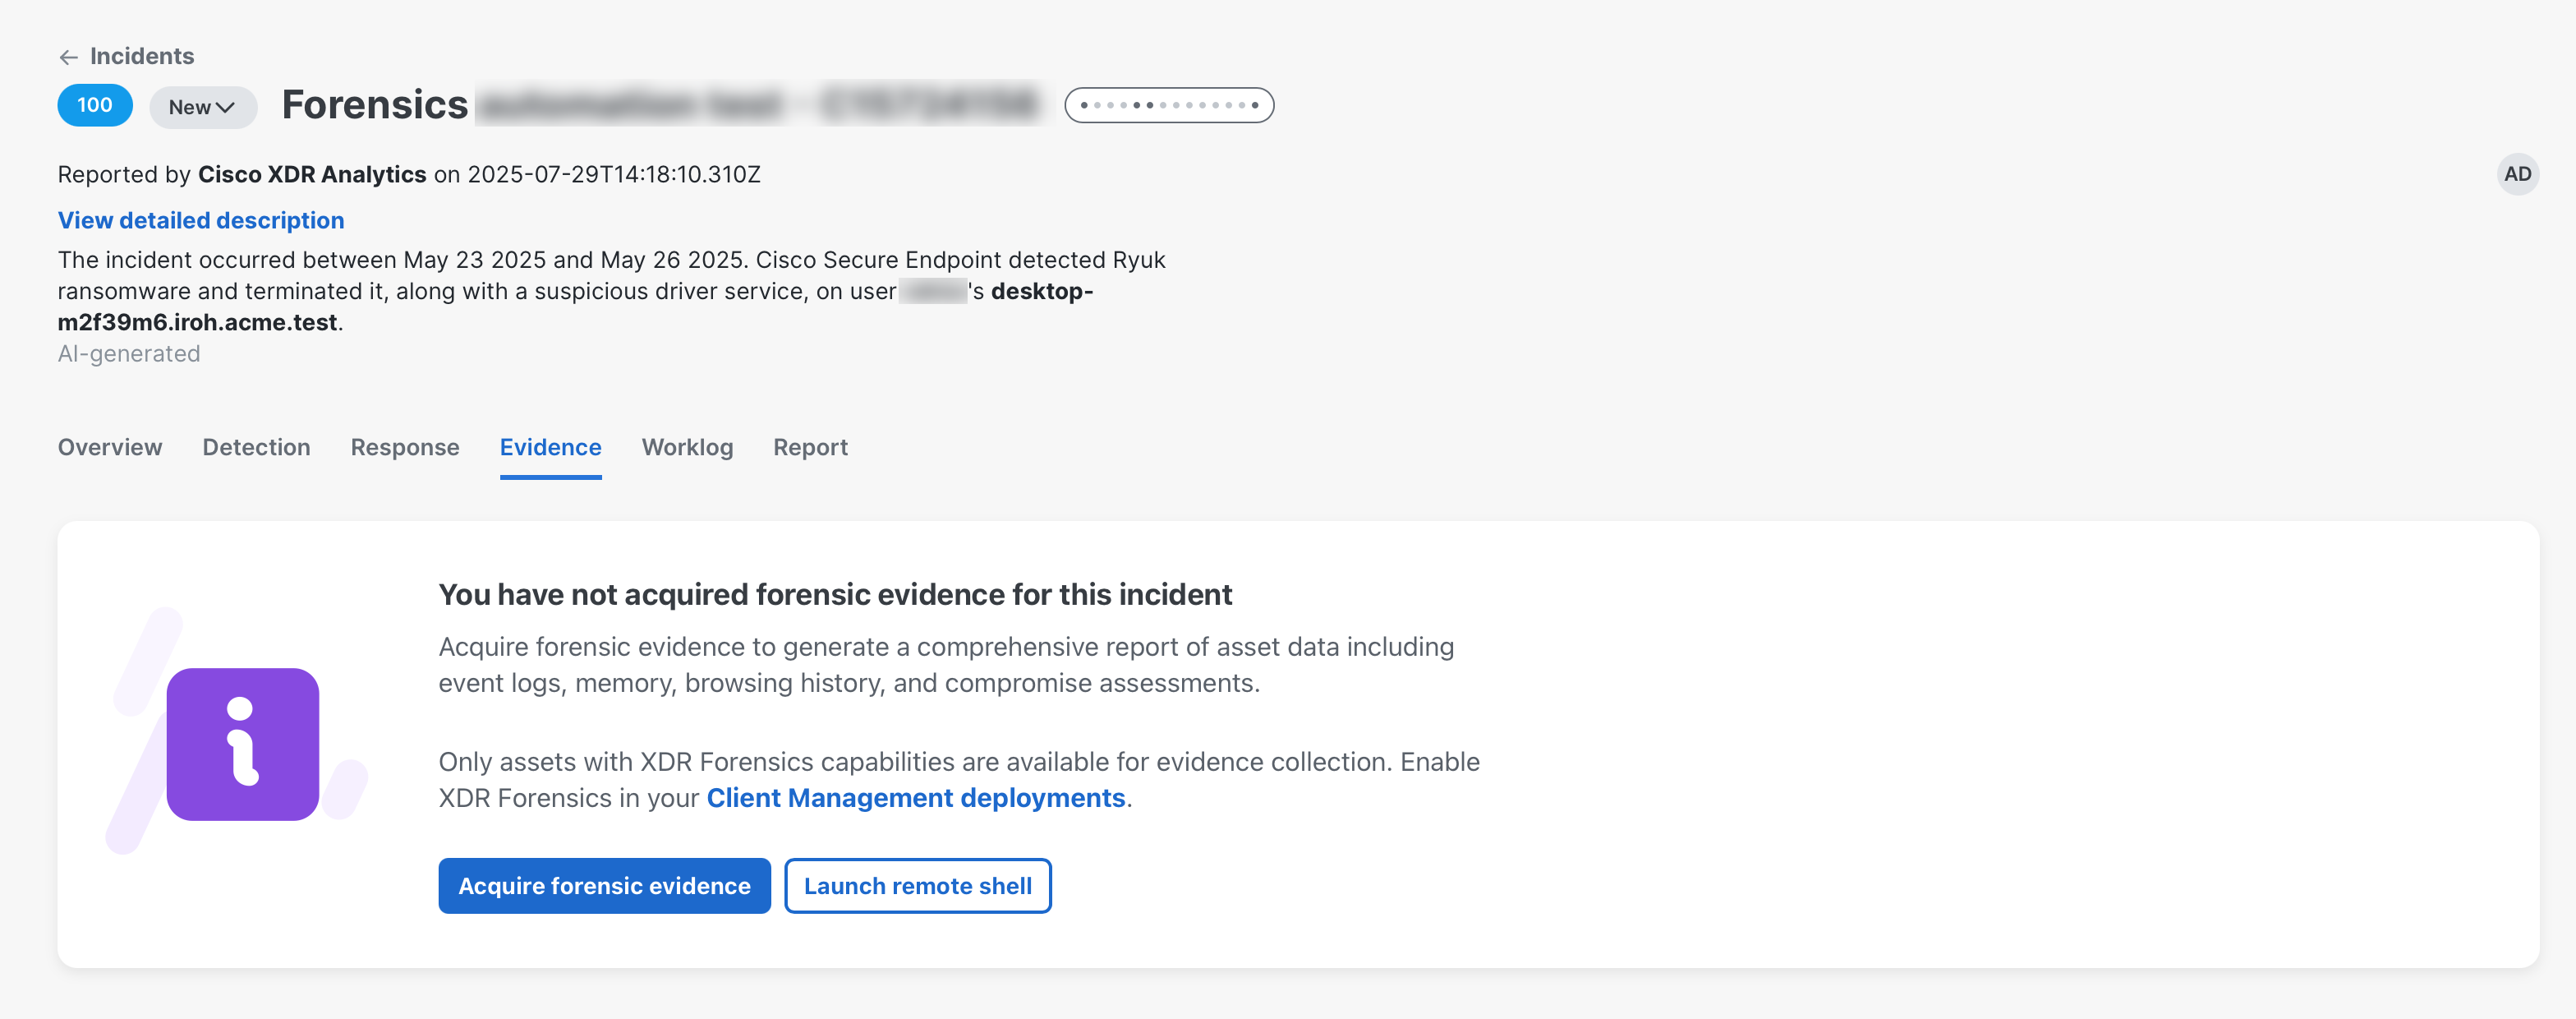
If you are accessing the Evidence tab in the current incident for the first time, a message is displayed indicating you must acquire forensic evidence for the current incident.
-
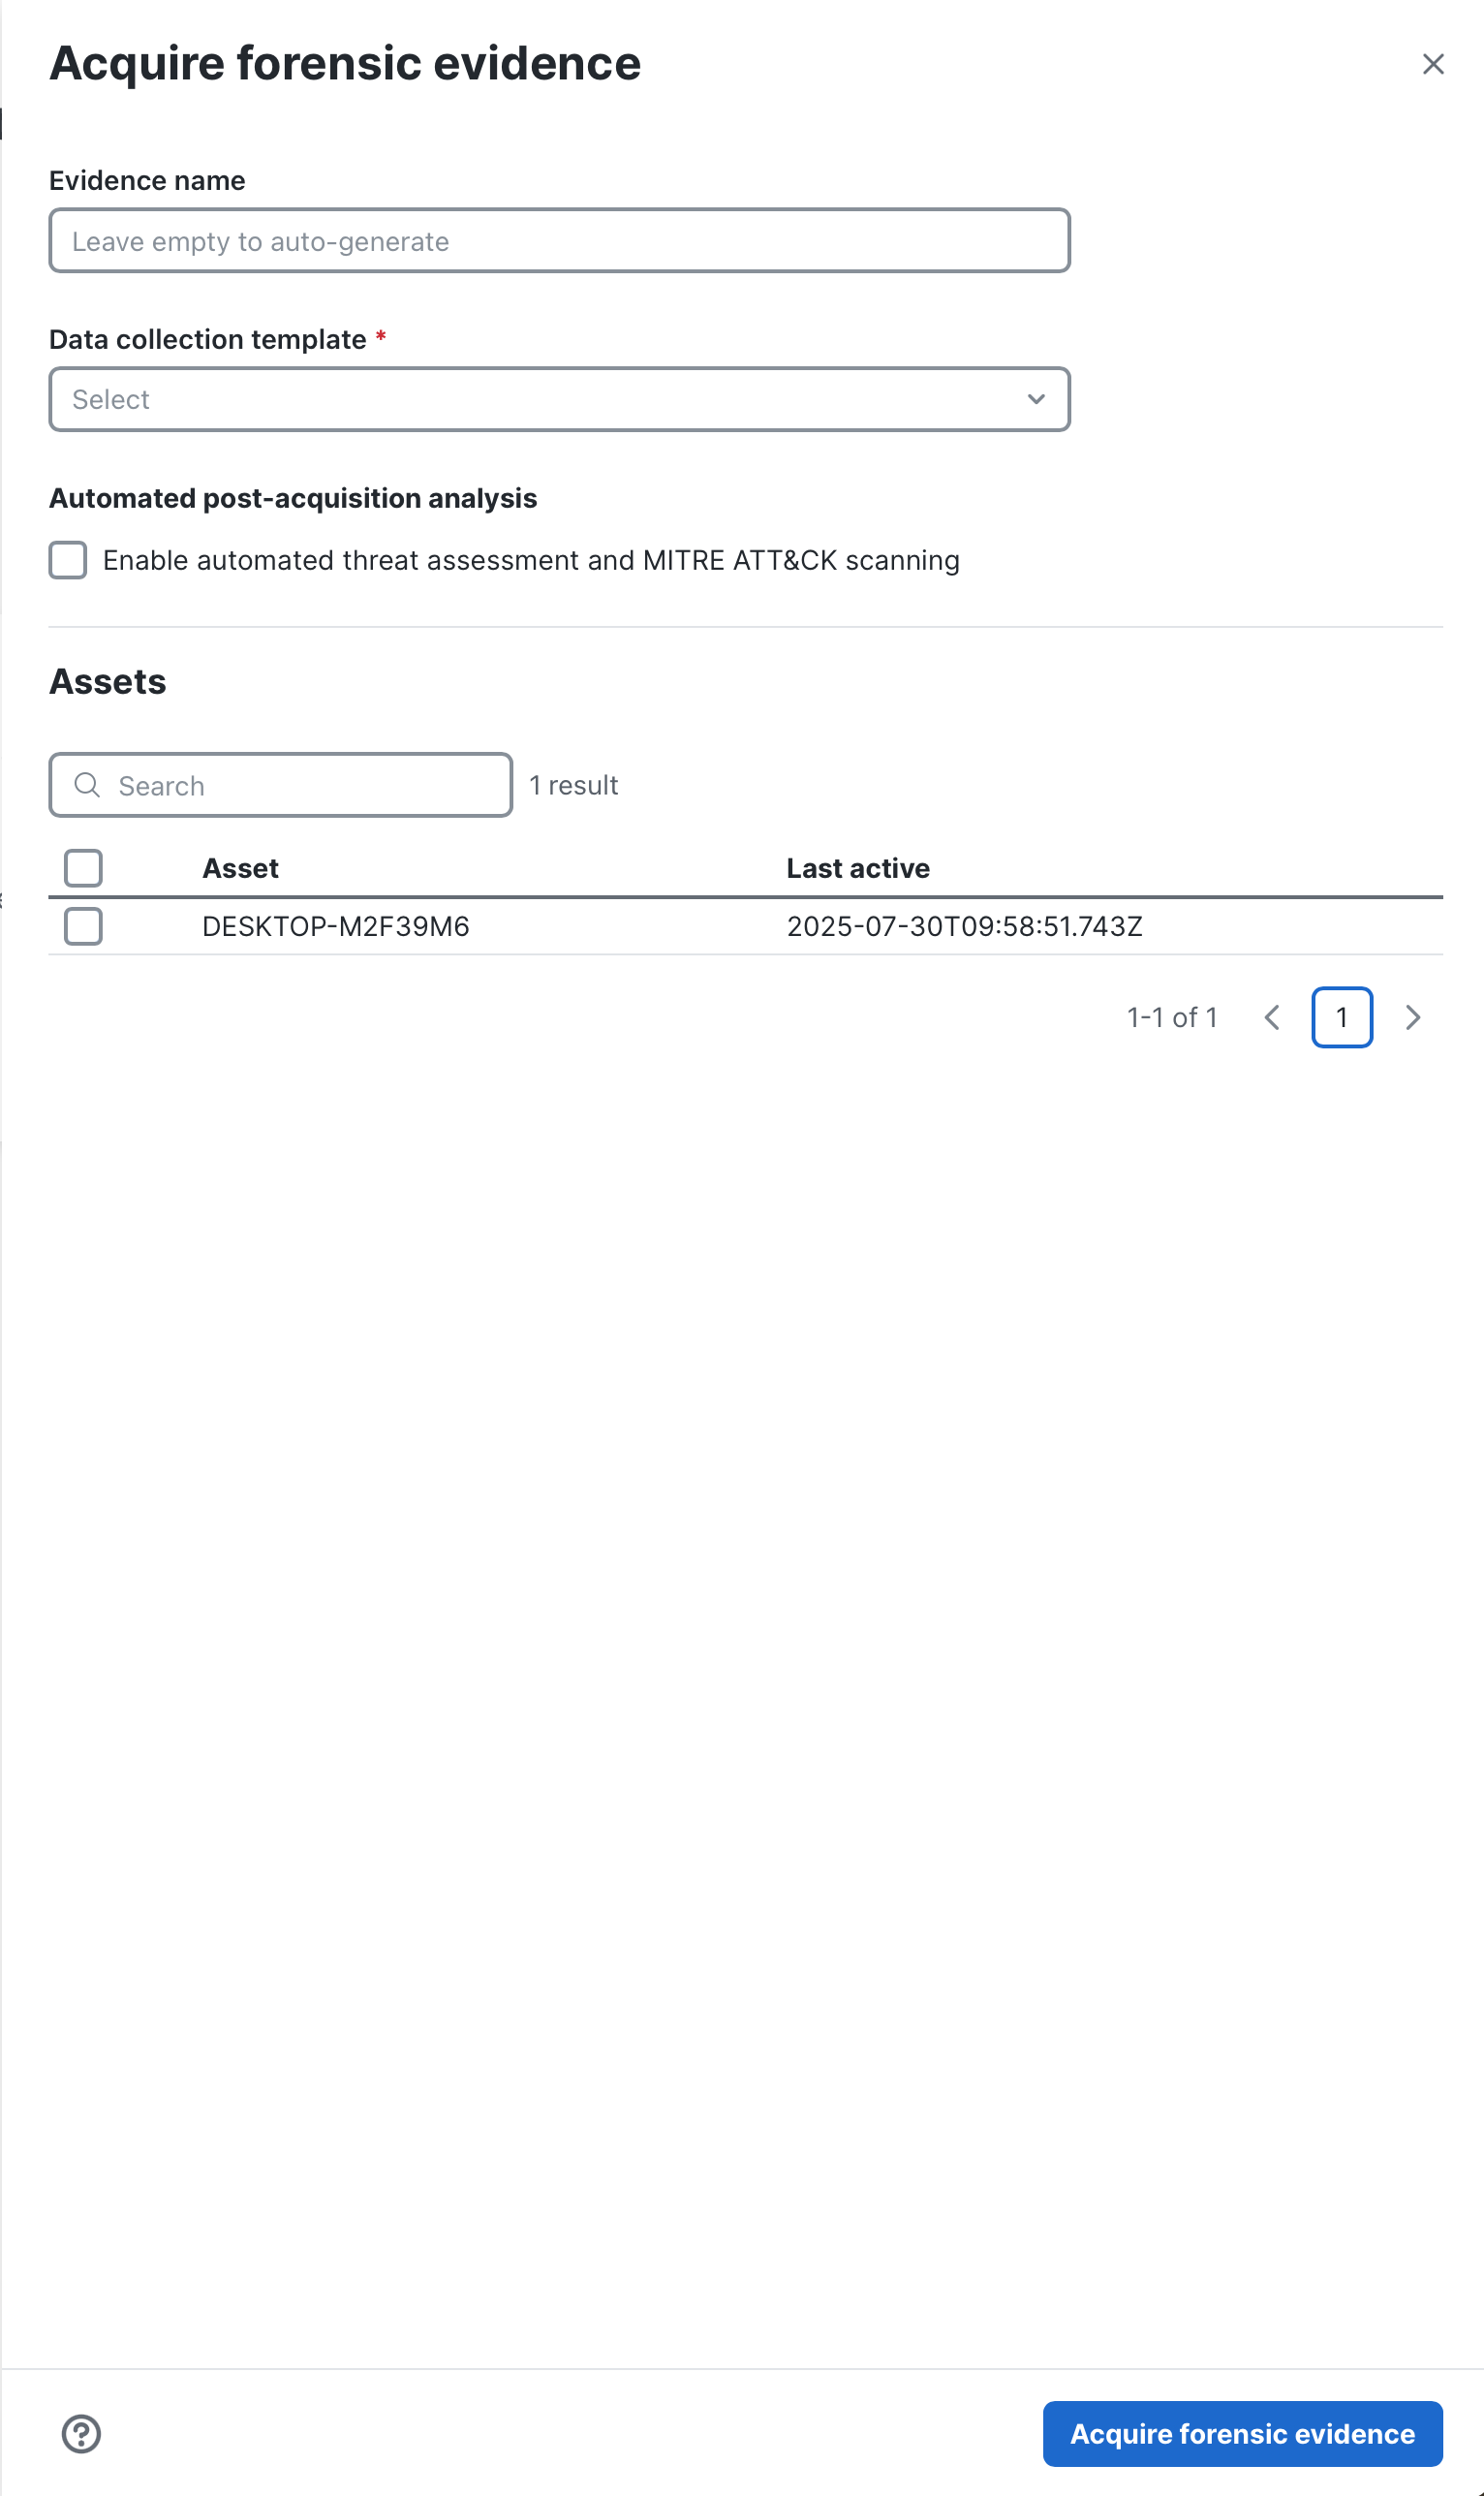
Click Acquire forensic evidence to open the Acquire forensic evidence drawer. If you have already acquired forensic data from assets within the current incident, click the Actions drop-down list in the upper right corner of the evidence table and choose Acquire forensics evidence.
-
In the Evidence name field, enter a unique name for the evidence acquisition. If you leave it blank, the name will be auto-generated.
-
From the Data collection template drop-down list, choose the type of data to be collected during an acquisition task. For details on the predefined acquisition profiles, see the Acquisition Profiles section in the XDR Forensics Knowledge Base.
-
Check the Enable automated threat assessment and MITRE ATT&CK scanning check box to enable all the DRONE and MITRE ATT&CK analyzers. We highly recommend that you enable the setting to provide prioritized threat intelligence to help accelerate investigations with minimal impact on system resources. For details, see the Step 4 - Analysis section under Task Creation in the XDR Forensics Knowledge Base.
-
In the Assets area, check the check box next to the assets that you want to include in the evidence acquisition. You can search for an asset in the Search field or sort by the Asset column.
-
In the Assets without XDR Forensics enabled panel, click the
 (Expand) icon to display a list of assets that are part of a deployment that does not include the XDR Forensics module. To add these assets to the Assets area, you must move the devices to a deployment that includes the XDR Forensics module. For more information, see the Move to Deployment section in the Clients help topic.
 -
Click Acquire forensic evidence.
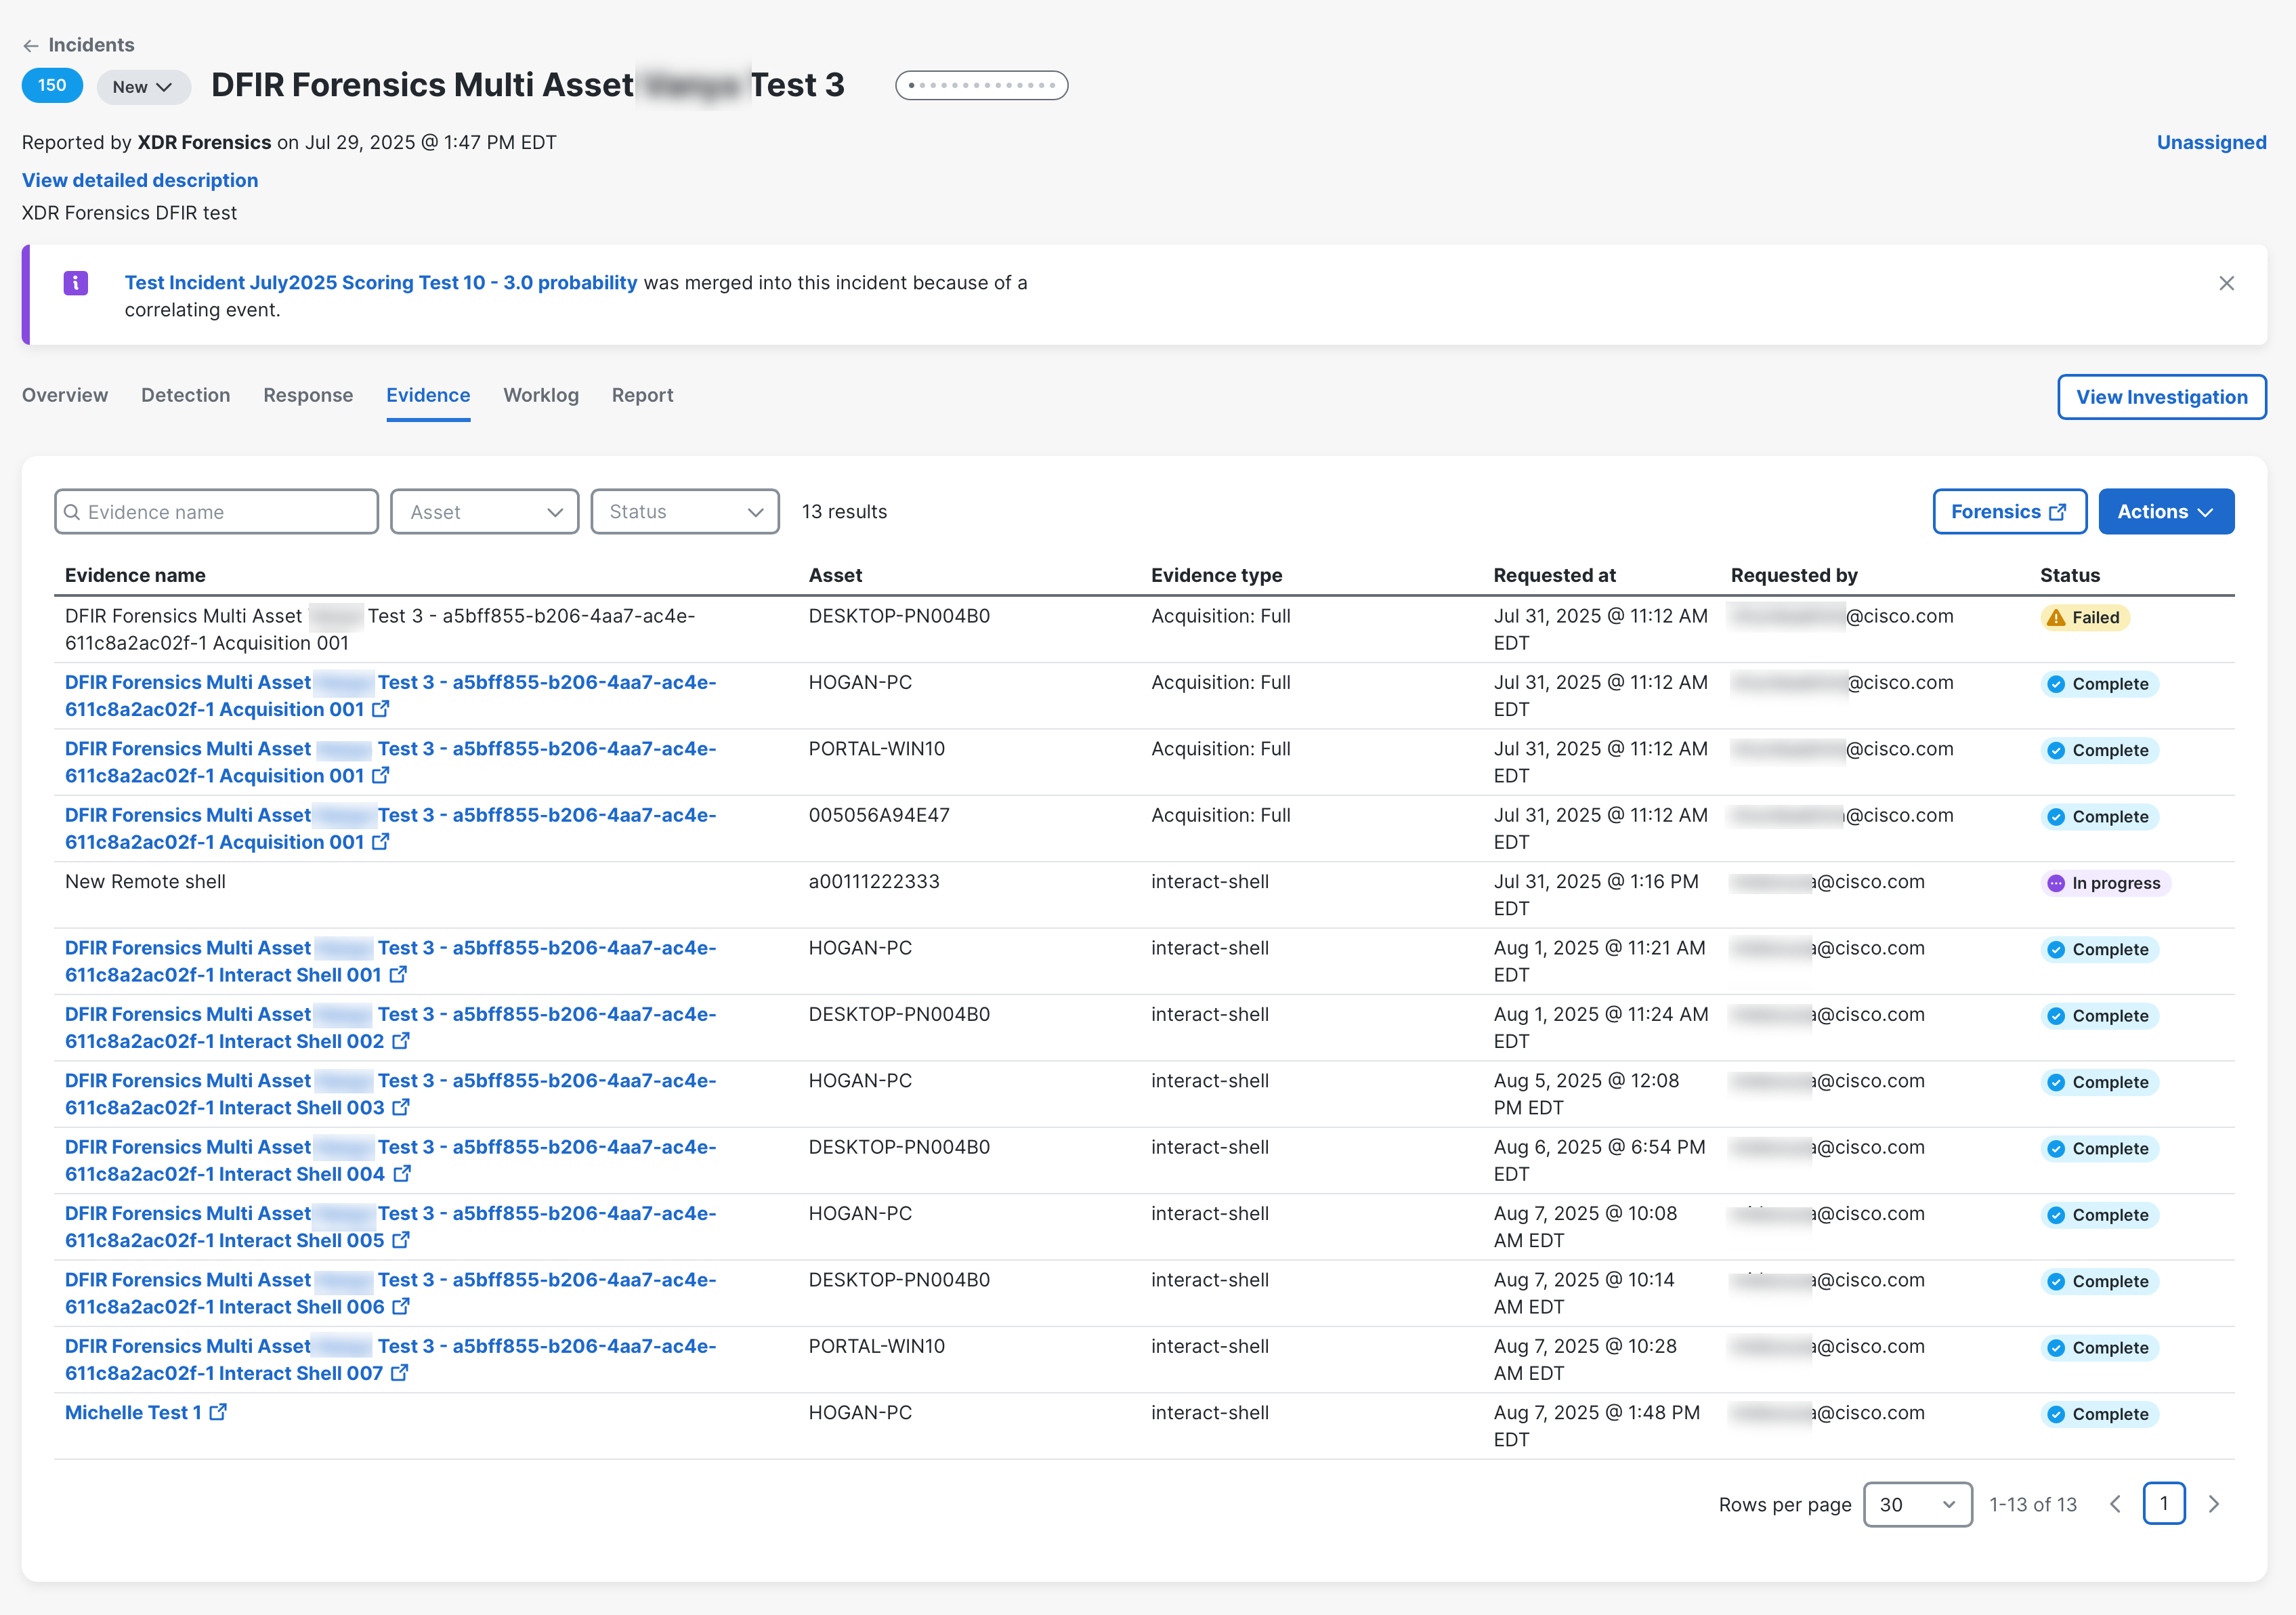
Once you have forensic acquisition is complete, you can view the evidence data from the selected assets.
Click Forensics in the upper right corner to open XDR Forensics in a new tab. For more information, see XDR Forensics.
|
Column Name |
Description |
|---|---|
|
Evidence name |
Name of the evidence profile. Click the name to open the evidence details in XDR Forensics UI in a new tab. If a link is not provided for the evidence, the task has failed and you must request to acquire the forensic evidence or launch the remote shell session again. |
|
Asset |
Name of the asset. |
|
Evidence type |
Type of data collected during evidence acquisition or remote shell. |
|
Requested at |
Date and time the acquisition or remote shell session was requested by the user. |
|
Requested by |
The email of the user who requested the acquisition or remote shell session. |
|
Status |
Displays the status of the acquisition or remote shell session as a color-coded tag. The following is a list of statuses:
|
You can filter the evidence by asset, status, or evidence type to narrow the display to only those evidence you want to view. Click the Asset, Status, or Evidence type drop-down list and check the check boxes for which asset, status, or evidence type you want displayed in the list.
Enter the search criteria in the Evidence name field to search for evidence profiles by evidence name. Search entries are not case sensitive. The evidence profiles that match your search criteria are displayed in the list of evidence profiles.
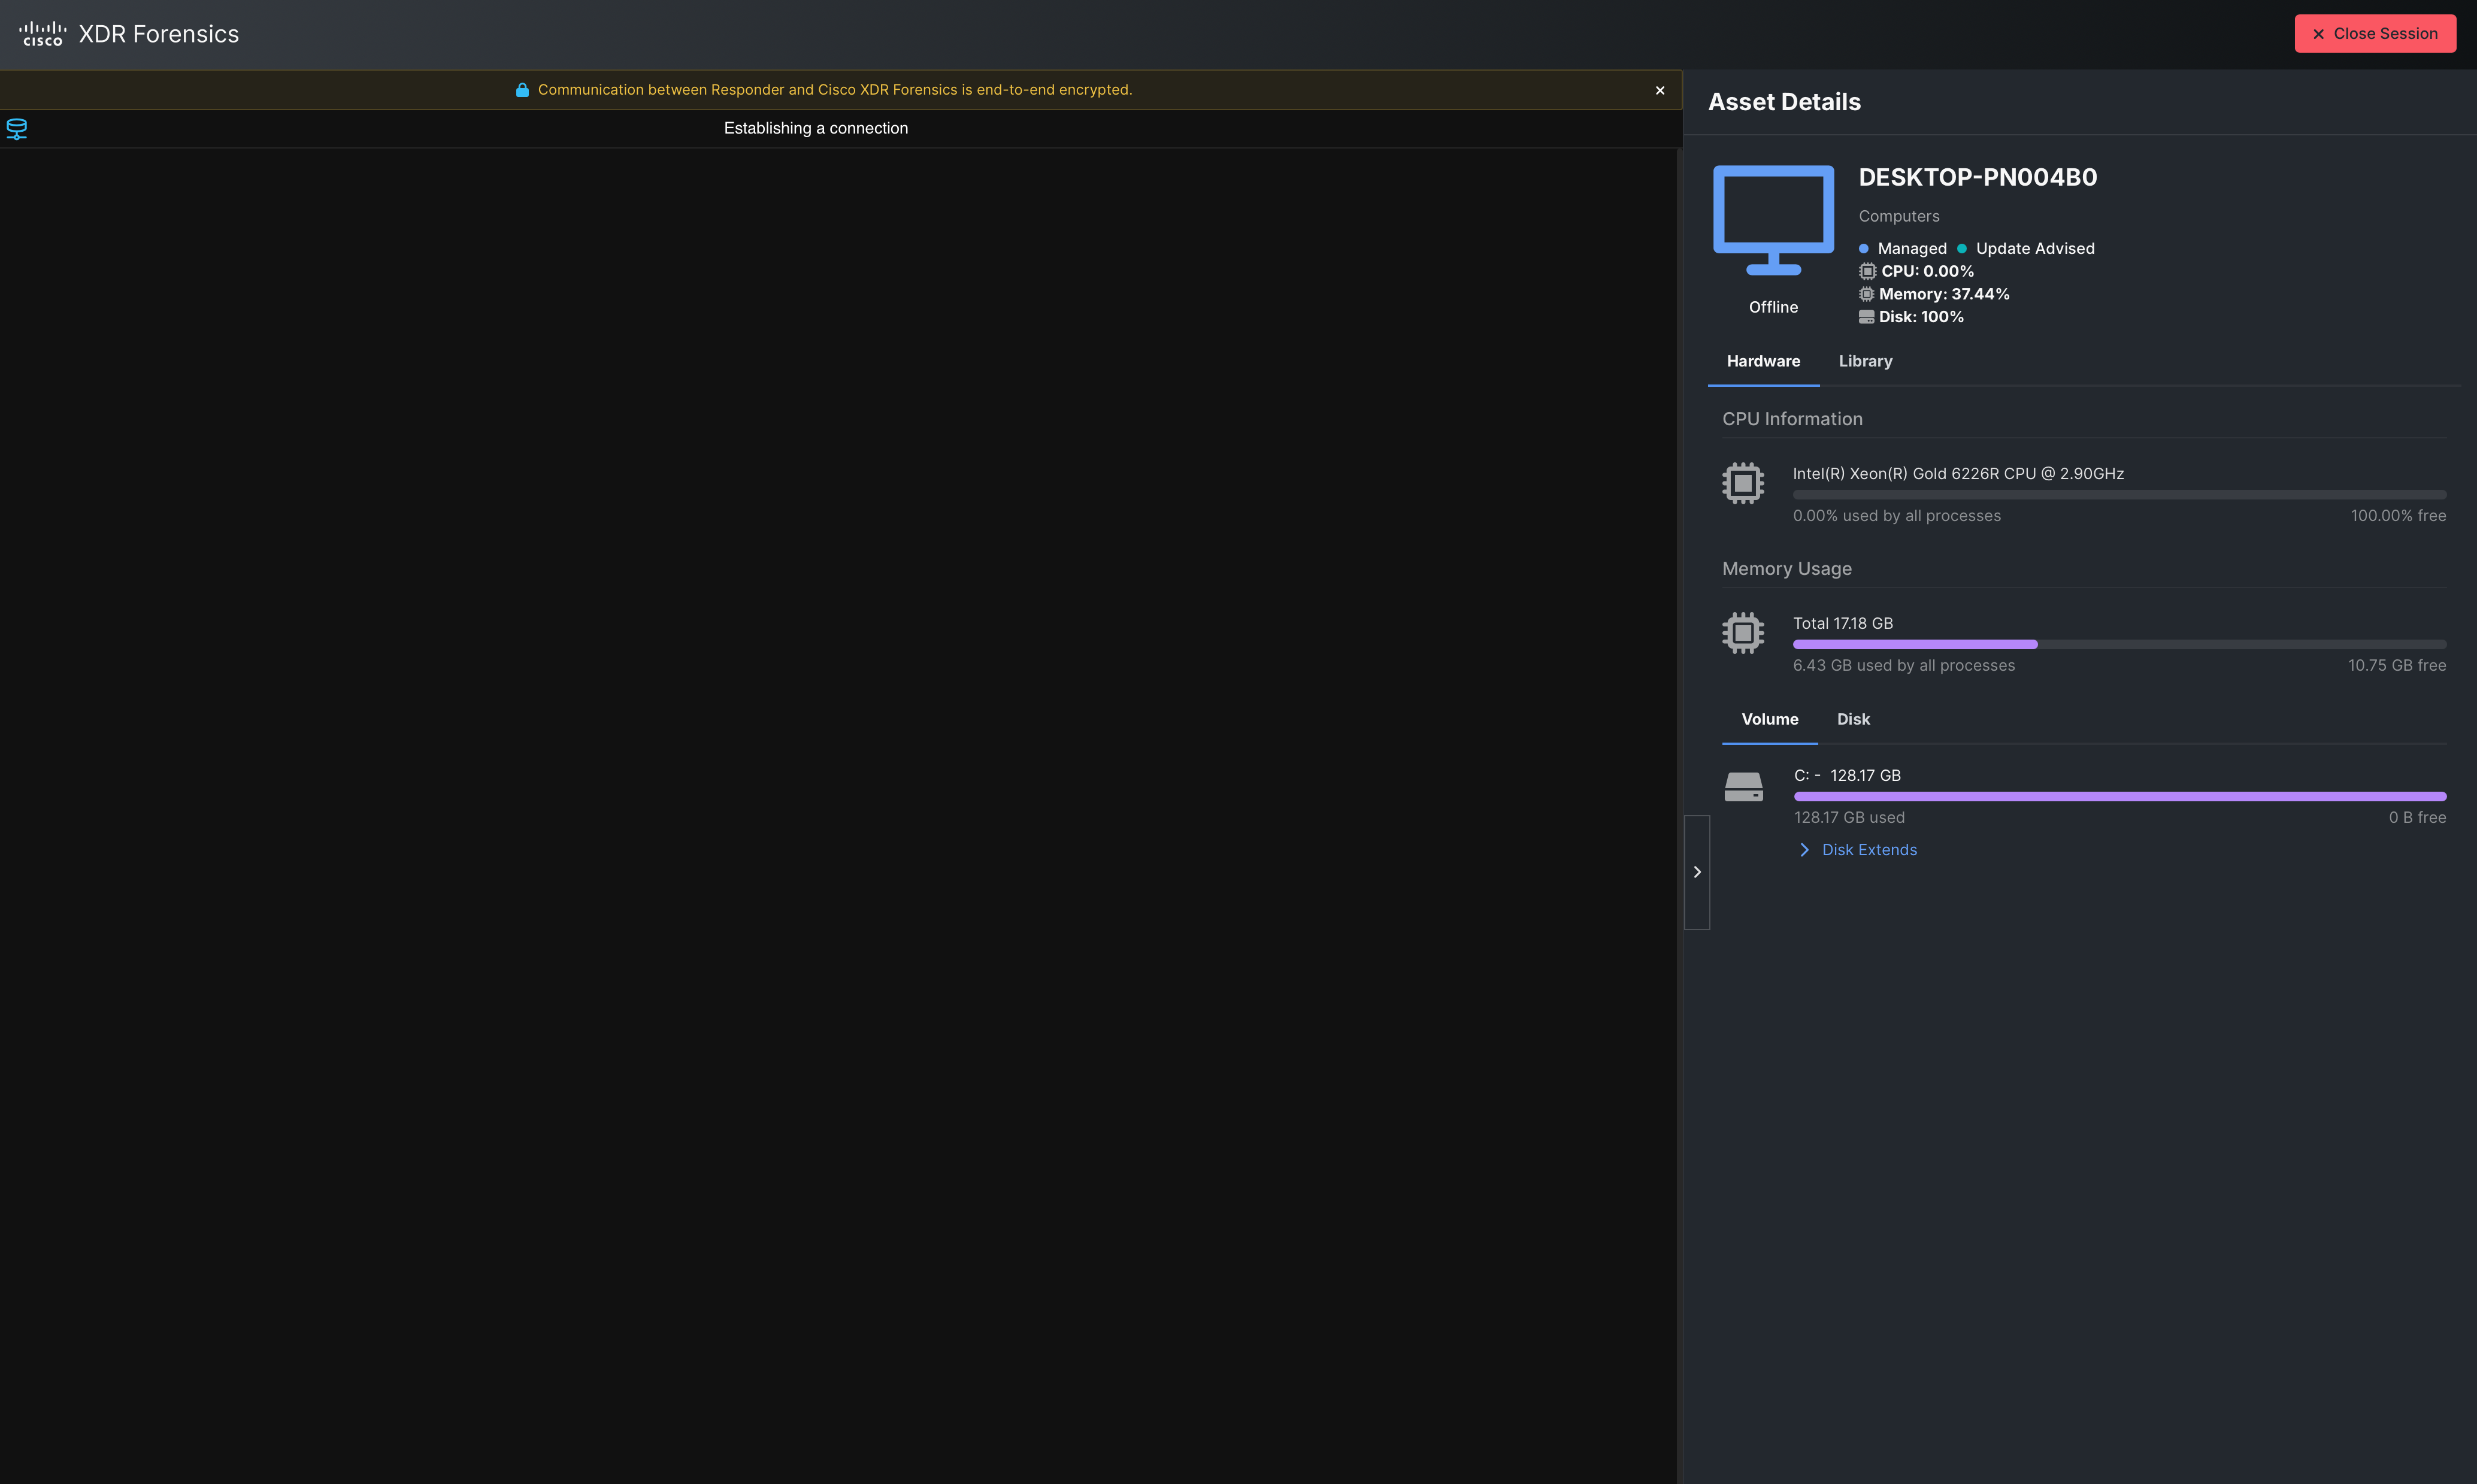
XDR Forensics includes a comprehensive secure remote shell that is cross-platform and provides a standardized command set for Windows and macOS to empower and greatly simplify the investigation process. Investigators and incident responders can connect to their assets easily by starting a remote shell session using the Launch remote shell drawer. When a remote shell session is initiated, XDR Forensics connects to the asset in just a few seconds and provides a command line interface for investigators to begin their triage, mitigation, or other remediation actions. For more information about XDR Forensics remote shell capabilities and a list of supported commands, see the XDR Forensics Knowledge Base.
Note: Only users with an Administrator or Incident Responder role can execute commands in remote shell.
To launch a remote shell:
-
Navigate to the incident detail and click the Evidence tab.
-
If you are accessing the Evidence tab in the current incident for the first time, a message is displayed indicating you must acquire forensic evidence or launch remote shell for the current incident.
-
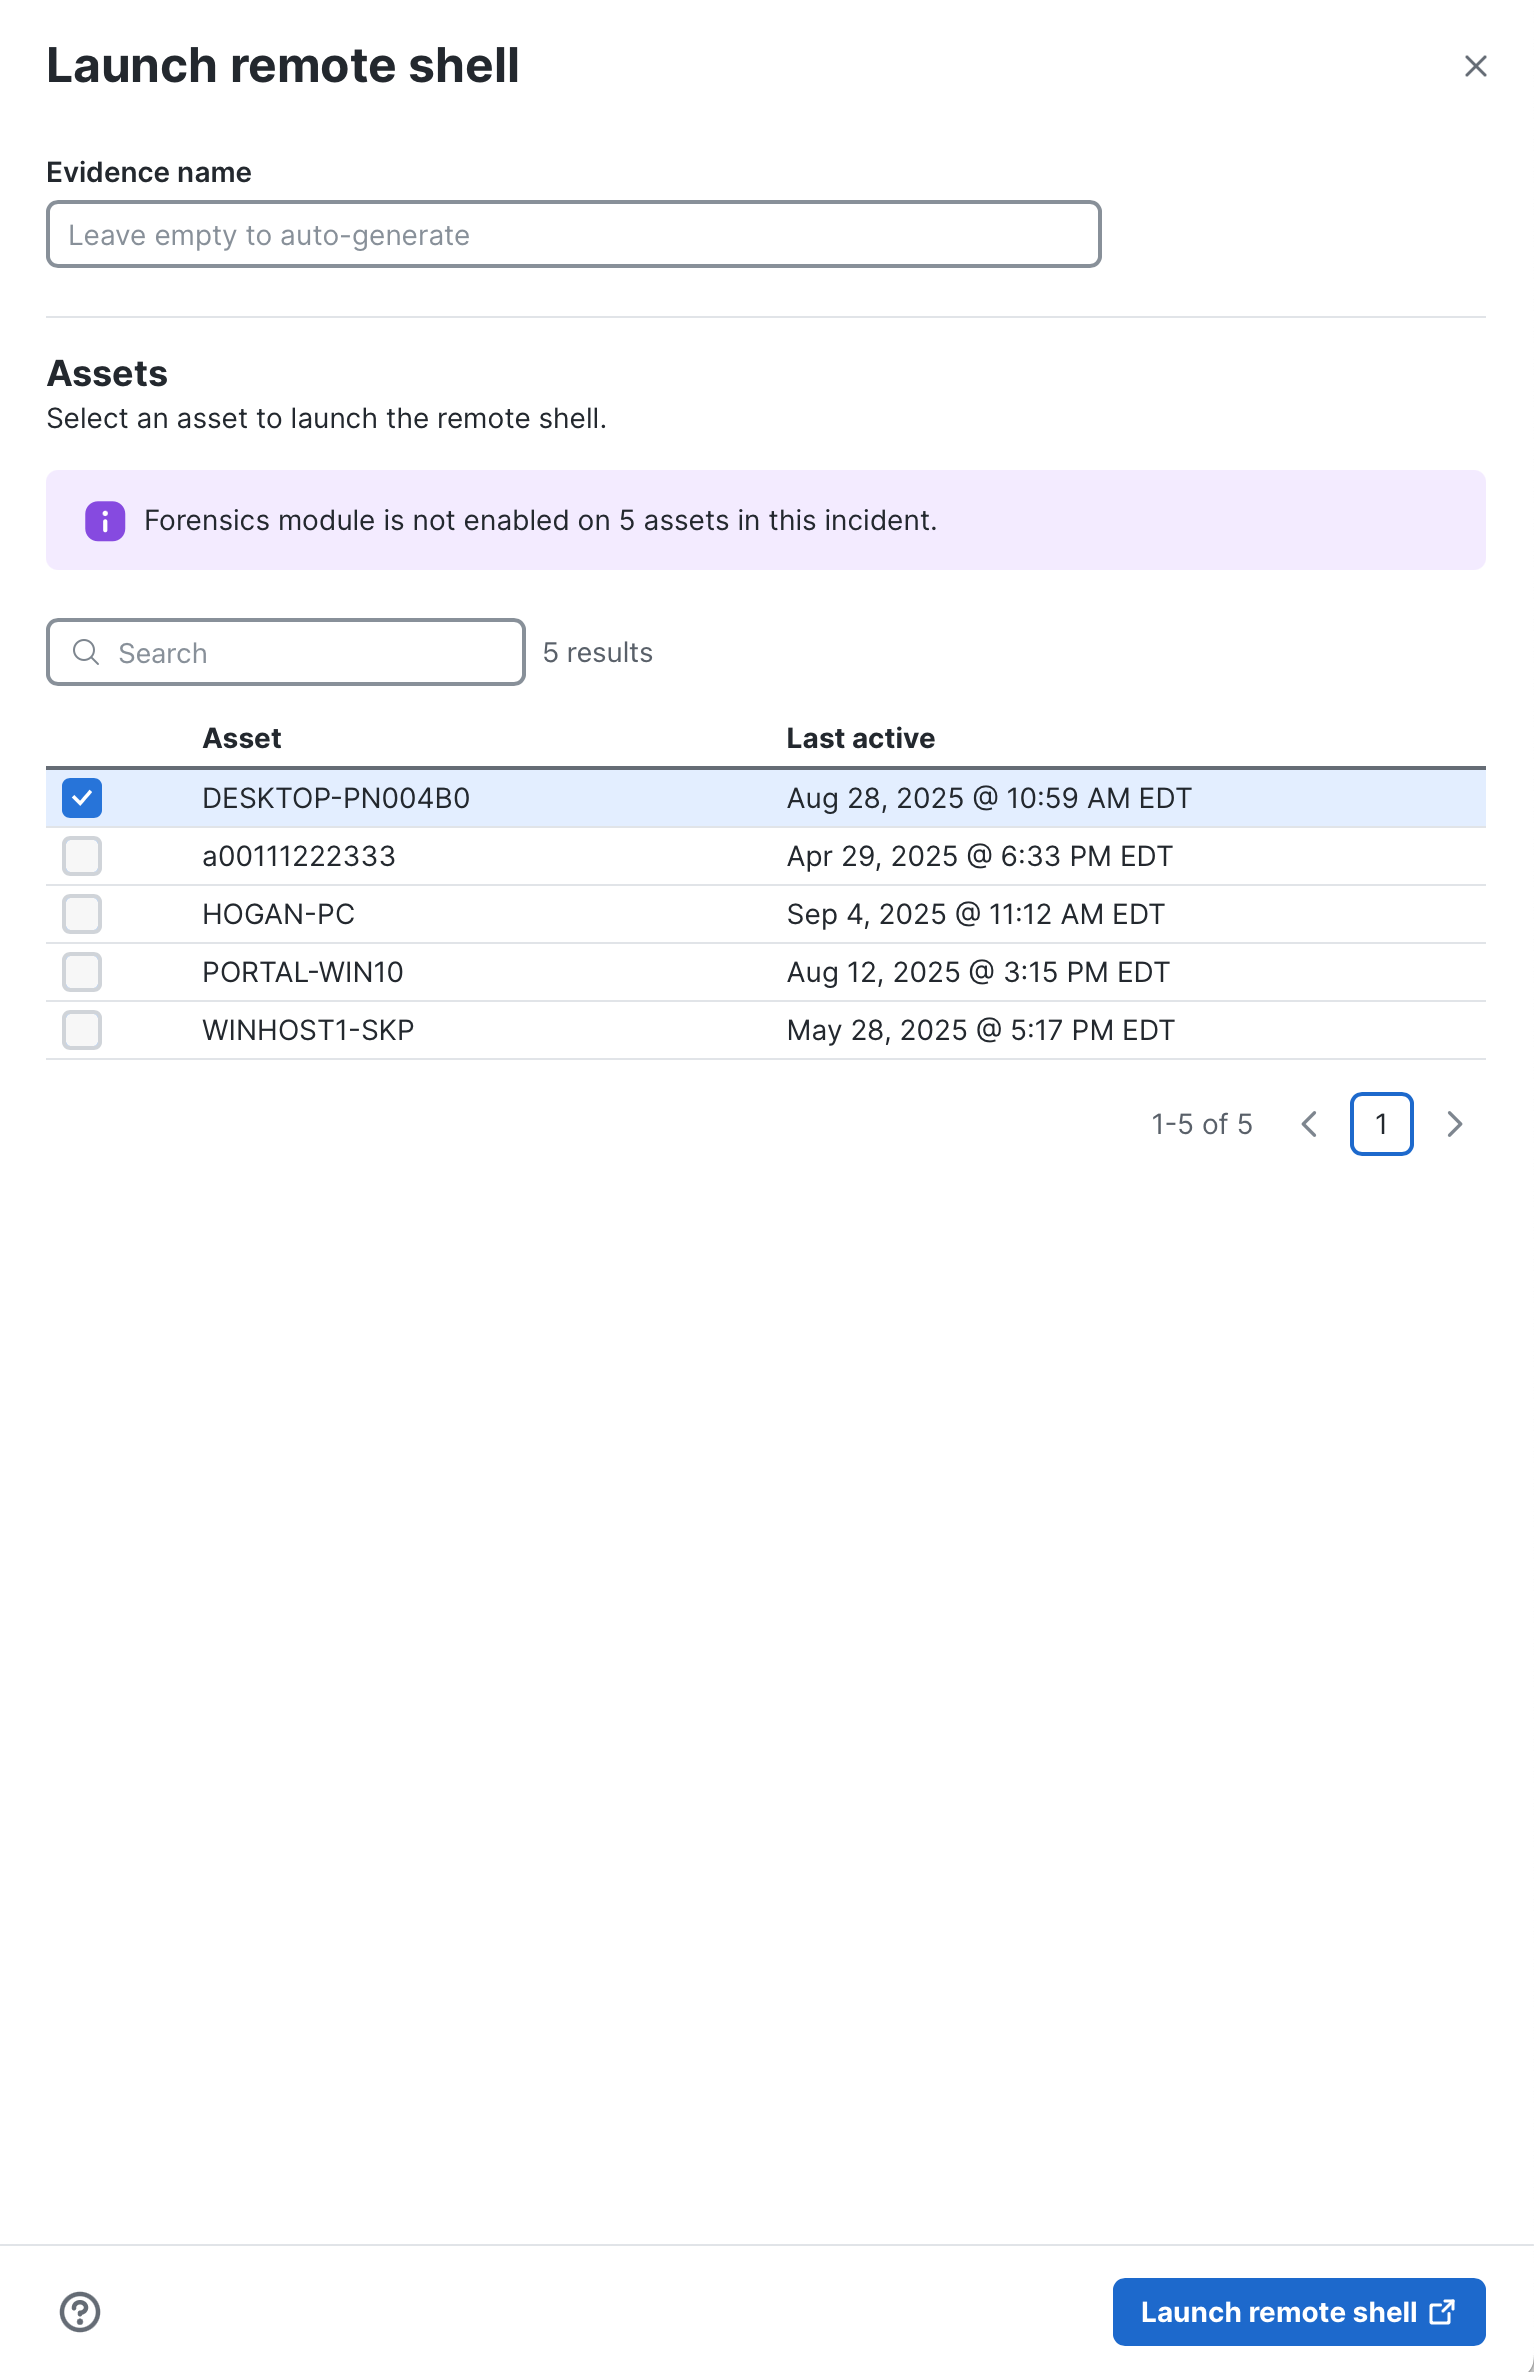
Click Launch remote shell to open the Launch remote shell drawer. If you have already acquired forensic data from assets within the current incident, choose Launch remote shell from the Actions drop-down list in the upper corner of the evidence table.
-
In the Evidence name field, enter a unique name. If you leave it blank, the name will be auto-generated.
-
In the Assets area, check the check box next to the asset that you want to open a remote shell. You can search for an asset in the Search field or sort by the Asset column.
-
In the Assets without XDR Forensics enabled panel, click the
 (Expand) icon to display a list of assets that are part of a deployment that does not include the XDR Forensics module. To add these assets to the Assets area, you must move the devices to a deployment that includes the XDR Forensics module. For more information, see the Move to Deployment section in the Clients help topic.
 -
Click Launch remote shell.
-
A new tab will open with a remote shell into the selected asset.
-
Click Close Session to close the remote shell session.
Note: If you close the remote shell session by closing the browser tab, the session will remain active for 30 minutes and the acquisition status on the Evidence tab will display In progress.
