Response
The Response tab in the incident detail displays the playbook that can be used to assist in identifying, containing, and eradicating the threat, and then restoring systems to recover from the threat. Workflows are available for execution to automate some of the response tasks; notes are available to document your findings throughout the incident response process.
The name of the playbook that is assigned to the incident and the date it was published is displayed above the tasks.
Note: It may take up to a few minutes for the correct custom playbook to be assigned to an incident. So if the incident is accessed during this time, it may have the default Cisco Managed Incident Playbook assigned to it.
Note: You can manage the playbooks that are assigned to incidents from the Playbooks feature in Administration (Administration > Playbooks). For more information, see Playbooks.
It is recommended that you go through each incident response process in the order presented to make sure you have performed all the recommended tasks.
By default, the tasks with a Not applicable status are hidden in the list of response tasks. To view all the tasks, including the Not applicable tasks, click the Hide Not applicable tasks toggle to off.
The task status is displayed as a color-coded tag next to the task after a workflow is executed or when the status is set by the user. The following is a list of the statuses:
| Status | Color | Description |
|---|---|---|
|
Complete |
Blue |
The workflow has been executed and completed. The status can also be manually set as Complete by the user when adding a note to the task. |
|
Partially complete |
Blue |
The workflow has been executed and completed but one or more actions may have failed. Click View run in the task drawer and view the workflow run details for more information. |
|
Running |
Purple |
The workflow execution has been started by the user and the workflow is currently running. Once completed, the status will change to Complete or an error. |
|
Workflow failed |
Red |
The workflow execution has been started by the user but it failed to complete. |
|
Failed to load Assets, Failed to load Observables, or Failed to load Assets and Observables |
Red |
The asset data, observable data, or asset and observable data could not be retrieved due to HTTP network errors. Hover over the tag and click Try again to attempt to retrieve the assets, observables, or assets and observables again. |
|
Action required |
Yellow |
The workflow is executing but an Automation task (approval or prompt) requires user input before the workflow can continue. |
|
Not applicable |
Grey |
The workflow requires certain observable types from the incident but no observables for that type exist in the incident or the status has been manually set as Not applicable by the user when adding a note to the task to indicate that the task is not applicable to the current incident response process. Note: By default, tasks that are marked with the Not applicable status are hidden from display. You can display the Not applicable tasks by clicking the Hide not applicable tasks toggle to off. |
All tasks include the ![]() (Add Note) icon to document your findings and the Generate note button to generate a note using AI. You can assign a Not applicable or Complete status to the task when you add a note.
(Add Note) icon to document your findings and the Generate note button to generate a note using AI. You can assign a Not applicable or Complete status to the task when you add a note.
The Generate note button creates a draft note for the task using AI, summarizing the task description and relevant incident information to help capture the analyst's work for the playbook task. You can review and edit the note before adding it.
Note: The Generate note button is not available in the incident detail with AI analysis view.
-
Click Generate note. The Generate note changes to Generating while the note is being generated by AI.
If the note fails to generate due to HTTP network errors, a Note failed error tag is displayed. You can click the tag and click Try again to generate the note again.
-
Once completed, click Review note next to the Action required tag. The Review Note dialog box is displayed with the AI-generated note text in the Preview view.
-
Click the
 (Edit code) icon to edit the AI-generated note in markdown using the formatting toolbar to format the text, if necessary, or click Regenerate in the bottom left corner if you want to regenerate the note using AI. The date and time the note was last generated by AI or edited by a user is displayed below the content.
To remove the AI-generated note, click Discard or click Close to keep a draft of the AI-generated note and close the Review Note dialog box. If you close the Review Note dialog box while editing, your changes will not save.
-
Once completed, click the Add note drop-down and choose one of the following:
-
Add note - Adds the note to the task drawer, Actions taken panel, and Worklog tab without setting a status.
-
Add note and set as "Complete" - Adds the note to the task drawer, Actions taken panel, and Worklog tab, and sets the task status as Complete. The status is displayed next to the task.
-
Add note and set as "Not applicable" - Adds the note to the task drawer, Actions taken panel, and Worklog tab, and sets the task status as Not applicable. The status is displayed next to the task.
To remove the task status, click Generate note and choose Add note and remove "Complete" status or Add note and remove "Not applicable" status in the Review Note dialog box.
-
The ![]() (Add Note) icon allows you to manually add notes about the incident as you go through the triage and remediation process.
(Add Note) icon allows you to manually add notes about the incident as you go through the triage and remediation process.
-
Click the
 (Add Note) icon to open a text editor in the task drawer where you can document your findings.
 You can click Expand to open the text editor in a popup.
-
Enter a note about the incident using markdown or regular text. Use the formatting toolbar to format the text, if necessary. Click the
 (Live code) icon to open a pane on the right in the text box to display the text in real-time as changes are made to the markdown code on the left.
Note: If you navigate away from the text editor while editing, the note is automatically saved as a draft for the current browser tab only. The draft content is not available if the same session of Cisco XDR is opened in another browser tab. To restore the note, return to the text editor and continue with your edits or click Undo or Use draft to remove or restore the draft content.
-
Click the
 (Preview code) icon to review the note text.
 -
Once completed, click the Add note drop-down and choose one of the following:
-
Add note - Adds the note to the task drawer, Actions taken panel, and Worklog tab without setting a status.
-
Add note and set as "Complete" - Adds the note to the task drawer, Actions taken panel, and Worklog tab, and sets the task status as Complete. The status is displayed next to the task.
-
Add note and set as "Not applicable" - Adds the note to the task drawer, Actions taken panel, and Worklog tab, and sets the task status as Not applicable. The status is displayed next to the task.
To remove the task status, click Add note to open a text editor and choose Add note and remove "Complete" status or Add note and remove "Not applicable" status.
-
If applicable, workflow tasks include the Execute or View button to execute workflows or respond to requests that automate part of the response process.
The workflows that are used in the response tasks act on the entire object (for example, creates a ServiceNow ticket) or specific observables in the incident (for example, contains file hashes using Endpoint Detection and Response). You execute the workflow based on observables found within the incident. Otherwise, the workflow applies to the entire incident.
-
If the workflow does not require observables from the incident, click the Execute button in the task to initiate the workflow.
-
If the workflow requires observables from the incident, click the Execute button in the task to open a drawer and check the check box next to the observables on which the workflow should be executed. Click Execute in the lower portion of the drawer to run the workflow on the selected observables.
- Use the Search bar in the upper portion of the drawer to quickly search the list of observables and use the Disposition drop-down list and check the check boxes next to the disposition values to narrow the display based on disposition. If you do not choose a disposition, all observables with all dispositions are displayed in the list. Click the
 (Clear) icon to remove your selections.
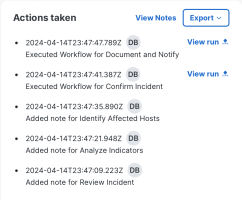
The result of running the workflow is added to the Actions taken panel. A more detailed output of the workflow is added to the Incident Worklog.
Note: The Execute button is disabled if the logged in user has a Security Analyst role assigned to their user account. Security Analysts can enter notes but cannot execute workflows.
During the execution of a workflow, the View button is displayed if user input is required for an Automation task (approval or prompt) before the workflow can continue. Click View next to the response task or click the task link in the task drawer to open the Automation task that requires user input. For details, see Tasks. Once you save your changes, the workflow continues to run and the status of the task is changed to Complete on the Response tab when the workflow is complete.
When you click a task in the list, the Task drawer opens where you can quickly view the notes that were manually added to the task and results of any automated workflows that have been executed for the task. You can also add notes to document your findings.
View Workflow Run
Click View run next to any executed workflow to open a drawer with more information about the workflow run. Click View run details to open the full Workflow Properties and view complete information about the workflow run. See Workflow Properties for more information.
Note: Action data is only available for 30 days. If the workflow execution has exceeded 30 days, the data is archived and will not be displayed in the Workflow Editor environment.
Add Note
Click the Add note button to open a text editor where you can document your findings. See Add Manual Note for more information.
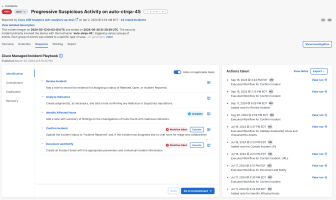
The identification phase of the incident response process helps determine whether the threat is valid and if the investigation should continue. This phase includes tasks to review the incident to determine that the incident is a true positive and anomalous behavior, analyze the indicators, confirm the incident and assign a status, and document all evidence related to the incident and notify involved parties.
If applicable, the Cisco Managed tasks that are automatically generated by AI based on the observables for the incident are display at the top of the list of tasks. Click the task link and an AI-generated response is displayed in a drawer. You can also add a manual note to document the response.
The Identification phase includes the following tasks and workflows in the Cisco Managed Incident Playbook:
|
Task |
Description |
Automation Workflow |
|---|---|---|
|
Review Incident |
Add a note to record the evidence for assigning an incident status. |
— |
|
Analyze Indicators |
Create judgment(s), as necessary, and add a note confirming any Malicious or Suspicious reputations. |
— |
|
Identify Affected Hosts |
Add a note with summary of findings on the investigations of hosts found with malicious indicators. |
— |
|
Confirm Incident |
Update the incident status to Open: Reported and if the incident has assignees, start a chat room for triage and collaboration. |
XDR - Confirm Incident This workflow updates an incident's status to Open: Reported, creates a chat room using a supported messaging integration, and then adds the incident's assignees to that room. If a room already exists, a new room is not created and the incident's assignees are re-added as needed. Currently supported integrations include Webex and Slack. |
|
Document and Notify |
Create an incident ticket with the appropriate parameters and contextual incident information. |
XDR - Document and Notify This automation workflow creates a ticket in your integrated IT Services Management System (ITSMS) and adds the ticket to this incident. Currently supported integrations include ServiceNow and Zendesk. |
-
Click the Generate note button to generate a note using AI for non-executable tasks or click the
 (Add Note) icon to open a text editor where you can document your findings. The note is added to the Actions taken panel and Worklog tab.
 -
Click the Execute button to run a workflow that automates the task. The result of running the workflow is added to the Actions taken panel and Worklog tab.
If the incident has multiple observables, click the Execute button to open the drawer and check the check box next to the observables on which the workflow should be executed, and then click Execute in the drawer to run the workflow.
Once all of the identification tasks have been performed, click Go to Containment to perform the containment phase of the incident response process.
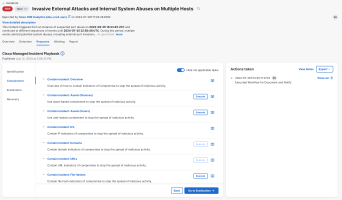
The containment phase of the incident response process includes tasks to identify the affected hosts and contain indicators of compromise to stop the spread of malicious activity. It also includes tasks to implement additional monitoring to detect any malicious activity related to the incident, and to identify vulnerabilities.
The Containment phase includes the following tasks and workflows in the Cisco Managed Incident Playbook:
|
Task |
Description |
Automation Workflow |
|---|---|---|
|
Contain Incident: Overview |
Overview of how to contain Indicators of Compromise to stop the spread of malicious activity. |
— |
|
Contain Incident: Assets (Devices) |
Use asset-based containment to stop the spread of malicious activity. |
XDR - Contain Incident: Assets This Automation workflow consumes one or more hostnames and attempts to isolate matching endpoints in all supported products. Currently supported integrations include Cisco Secure Endpoint, CrowdStrike, SentinelOne, Microsoft Defender for Endpoint, Microsoft Defender for Endpoint GCC, Trend Vision One, Cybereason, Palo Alto Cortex, and Darktrace /NETWORK. |
|
Contain Incident: Assets (Users) |
Use user-based containment to stop the spread of malicious activity. |
XDR - Contain Incident: Users This Automation workflow consumes one or more usernames or email addresses and attempts to lock out or disable matching users in all supported products. Currently supported integrations include Cisco Duo and Microsoft Entra ID. |
|
Contain Incident: IP Addresses |
Contain IP address indicators of compromise to stop the spread of malicious activity. |
XDR - Contain Incident: IP Addresses This Automation workflow consumes one or more IP addresses and attempts to block them in all supported products. Currently supported integrations include Cisco Secure Access (IPv4), Cisco Umbrella (IPv4 only) and Cisco XDR (intelligence feeds). |
|
Contain Incident: Domains |
Contain domain indicators of compromise to stop the spread of malicious activity. |
XDR - Contain Incident: Domains This automation workflow consumes one or more domains and attempts to block them in all supported products. Currently supported integrations include Cisco Secure Access and Cisco Umbrella. |
|
Contain Incident: URLs |
Contain URL indicators of compromise to stop the spread of malicious activity. |
XDR - Contain Incident: URLs This Automation workflow consumes one or more URLs and attempts to block them in all supported products. Currently supported integrations include Cisco Secure Access, Cisco Umbrella, and Cisco XDR (intelligence feeds). |
|
Contain Incident: File Hashes |
Contain file hash indicators of compromise to stop the spread of malicious activity. |
XDR - Contain Incident: File Hashes This Automation workflow consumes one or more SHA-256 file hashes and attempts to block them in all supported products. Currently supported integrations include Cisco Secure Endpoint, CrowdStrike, Microsoft Defender for Endpoint, Microsoft Defender for Endpoint GCC, Trend Vision One, and Palo Alto Cortex. |
|
Contain Incident: Quarantine Email Messages |
Contain email messages to stop the spread of malicious activity. |
XDR - Contain Incident: Quarantine Email Messages This workflow consumes one or more email message IDs and attempts to quarantine matching messages in all supported products. Currently supported integrations include Cisco Secure Email Threat Defense (via XDR response API), Microsoft Defender for Office 365, and Microsoft Defender for Office 365 GCC. |
|
Implement Additional Monitoring |
Implement additional monitoring that reviews host and network containment, and eradication success. |
— |
|
Identify Vulnerabilities |
Scan host(s) for vulnerabilities and add a note on the recommended patches to be applied and service request to have them installed, if submitted. |
XDR - Identify Vulnerabilities This Automation workflow consumes one or more hostnames and attempts to fetch vulnerability information from your integrated Endpoint Detection and Response (EDR) solutions. Currently supported integrations include Cisco Secure Endpoint, CrowdStrike, SentinelOne, Microsoft Defender for Endpoint, and Microsoft Defender for Endpoint GCC. |
-
Click the Generate note button to generate a note using AI for non-executable tasks or click the
 (Add Note) icon to open a text editor where you can document your findings. The note is added to the Actions taken panel and Worklog tab.
 -
Click the Execute button to run a workflow that automates the task. The result of running the workflow is added to the Actions taken panel and Worklog tab.
If the incident has multiple observables, click the Execute button to open the drawer and check the check box next to the observables on which the workflow should be executed, and then click Execute in the drawer to run the workflow.
Once all of the containment tasks have been performed, click Go to Eradication to perform the eradication phase of the incident response process.
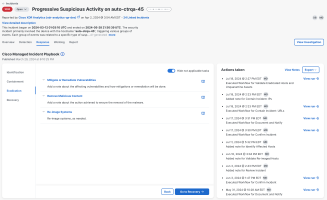
The eradication phase of the incident response process includes tasks to mitigate or remediate vulnerabilities, remove malicious content, validate eradication and restore hosts, and implement monitoring the recovery from the threat.
The Eradication phase includes the following tasks and workflows in the Cisco Managed Incident Playbook:
|
Task |
Description |
Automation Workflow |
|---|---|---|
|
Mitigate or Remediate Vulnerabilities |
Add a note about the affecting vulnerabilities and how mitigations or remediation will be done. |
— |
|
Remove Malicious Content |
Add a note about the action achieved to ensure the removal of the malware. |
— |
|
Delete Email Messages |
Deletes email messages from user mailboxes. |
XDR - Delete Email Messages This workflow consumes one or more email message IDs and attempts to delete matching messages in all supported products. Currently supported integrations include Microsoft Defender for Office 365 and Microsoft Defender for Office 365 GCC. |
|
Re-image Systems |
Re-image systems, as needed. |
— |
-
Click the Generate note button to generate a note using AI for non-executable tasks or click the
 (Add Note) icon to open a text editor where you can document your findings. The note is added to the Actions taken panel and Worklog tab.
 -
Click the Execute button to run a workflow that automates the task. The result of running the workflow is added to the Actions taken panel and Worklog tab.
Once all of the eradication tasks have been performed, click Go to Recovery to perform the recovery phase of the incident response process.
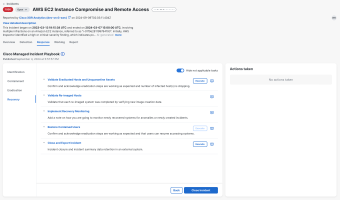
The recovery phase of the incident response process includes restoring the system to get you up and running.
The Recovery phase includes the following tasks and workflows in the Cisco Managed Incident Playbook:
|
Task |
Description |
Automation Workflow |
|---|---|---|
|
Validate Eradicated Hosts and Unquarantine Assets |
Confirm and acknowledge eradication steps are working as expected and number of infected host(s) is dropping. |
XDR - Unquarantine Assets This workflow consumes one or more hostnames and attempts to unquarantine matching endpoints in all the supported Endpoint Detection and Response (EDR) integrations. Currently supported EDRs include Cisco Secure Endpoint, CrowdStrike, SentinelOne, Microsoft Defender for Endpoint, Microsoft Defender for Endpoint GCC, Trend Vision One, Cybereason, Palo Alto Cortex, and Darktrace /NETWORK. |
|
Validate Re-imaged Hosts |
Validate that each re-imaged system was completed by verifying new image creation date. |
— |
|
Implement Recovery Monitoring |
Add a note on how you are going to monitor newly recovered systems for additional monitoring for anomalies or newly created incidents. |
— |
|
Restore Contained Users |
Confirm and acknowledge eradication steps are working as expected and that users can resume accessing systems. |
XDR - Restore Users This workflow consumes one or more usernames or email addresses and attempts to restore matching users in all supported products. Currently supported integrations include Cisco Duo and Microsoft Entra ID. |
|
Release Email Messages from Quarantine |
Move email messages back to user inboxes after verifying the messages are not malicious. |
XDR - Release Email Messages from Quarantine This workflow consumes one or more email message IDs and attempts to release matching messages from quarantine in all supported products. Currently supported integrations include Microsoft Defender for Office 365 and Microsoft Defender for Office 365 GCC. |
|
Close and Export Incident |
Incident closure and incident summary data retention in an external system. |
XDR - Close and Export Incident This workflow is designed to be executed when an incident is resolved and ready to be closed. The workflow will export the incident summary to a supported product and then mark the incident as Closed: Confirmed Threat. Currently supported integrations include Elastic Cloud and Splunk Cloud. |
-
Click the Generate note button to generate a note using AI for non-executable tasks or click the
 (Add Note) icon to open a text editor where you can document your findings. The note is added to the Actions taken panel and Worklog tab.
 -
Click the Execute button to run a workflow that automates the task. The result of running the workflow is added to the Actions taken panel and Worklog tab.
Click Close Incident to change the status of the incident to one of the Closed statuses. For details, see Available Statuses.
The Actions taken panel provides a view of all the notes that have been entered for the tasks and the results of any automated workflows that have been executed for the tasks.
Click View Notes to open the Worklog tab, where you can view all response the notes and audit log for the incident. For more information, see the Incident Worklog help topic.
Click View run next to any executed workflow to open the Workflow Run drawer and view a high-level summary of the workflow execution. The drawer includes information such as the workflow title, who it was started by, start and end date and time, status, and inputs.
Note: Action data is only available for 30 days. If the workflow execution has exceeded 30 days, the data is archived and will not be displayed in the Workflow Run drawer.
Click View run details to open the full Workflow Properties and view complete information about the workflow run. See Workflow Properties for more information.
Click Download and choose to download the response actions in JSON or CSV format.
