Incidents
The Cisco XDR Incidents feature helps you minimize the time spent on detection and response of correlated security events by providing the most critical information needed to detect, triage, investigate, and respond all in one place. With risk-based prioritization of security detections, you can focus on the most critical incidents and view recommendations that enable you to immediately diagnose, contain, and remediate the incident.
Incidents are groups of correlated events generated using data ingested from your integrated products. By correlating events which could be part of a larger threat into an incident, it reduces the time typically required to investigate individual security alerts or detections. Incidents are ranked to help you prioritize your investigation.
Cisco XDR uses extracted meta data to determine what the events have in common, which are referred to as common indicators. Common indicators include devices, IP addresses, host names, user names, and file hashes. The MITRE ATT&CK® framework is then followed to further identify the tactics, techniques, and procedures (TTPs) to model the sequencing of actions and threat behaviors which could be early indications of an attack.
With Cisco XDR Incidents feature, you can:
-
View a list of incidents, prioritized by risk.
-
Open the Incident drawer and view a high-level summary of the incident in one place.
-
Dive deeper into the incident detail to gain an understanding of the threat and quickly triage and remediate it.
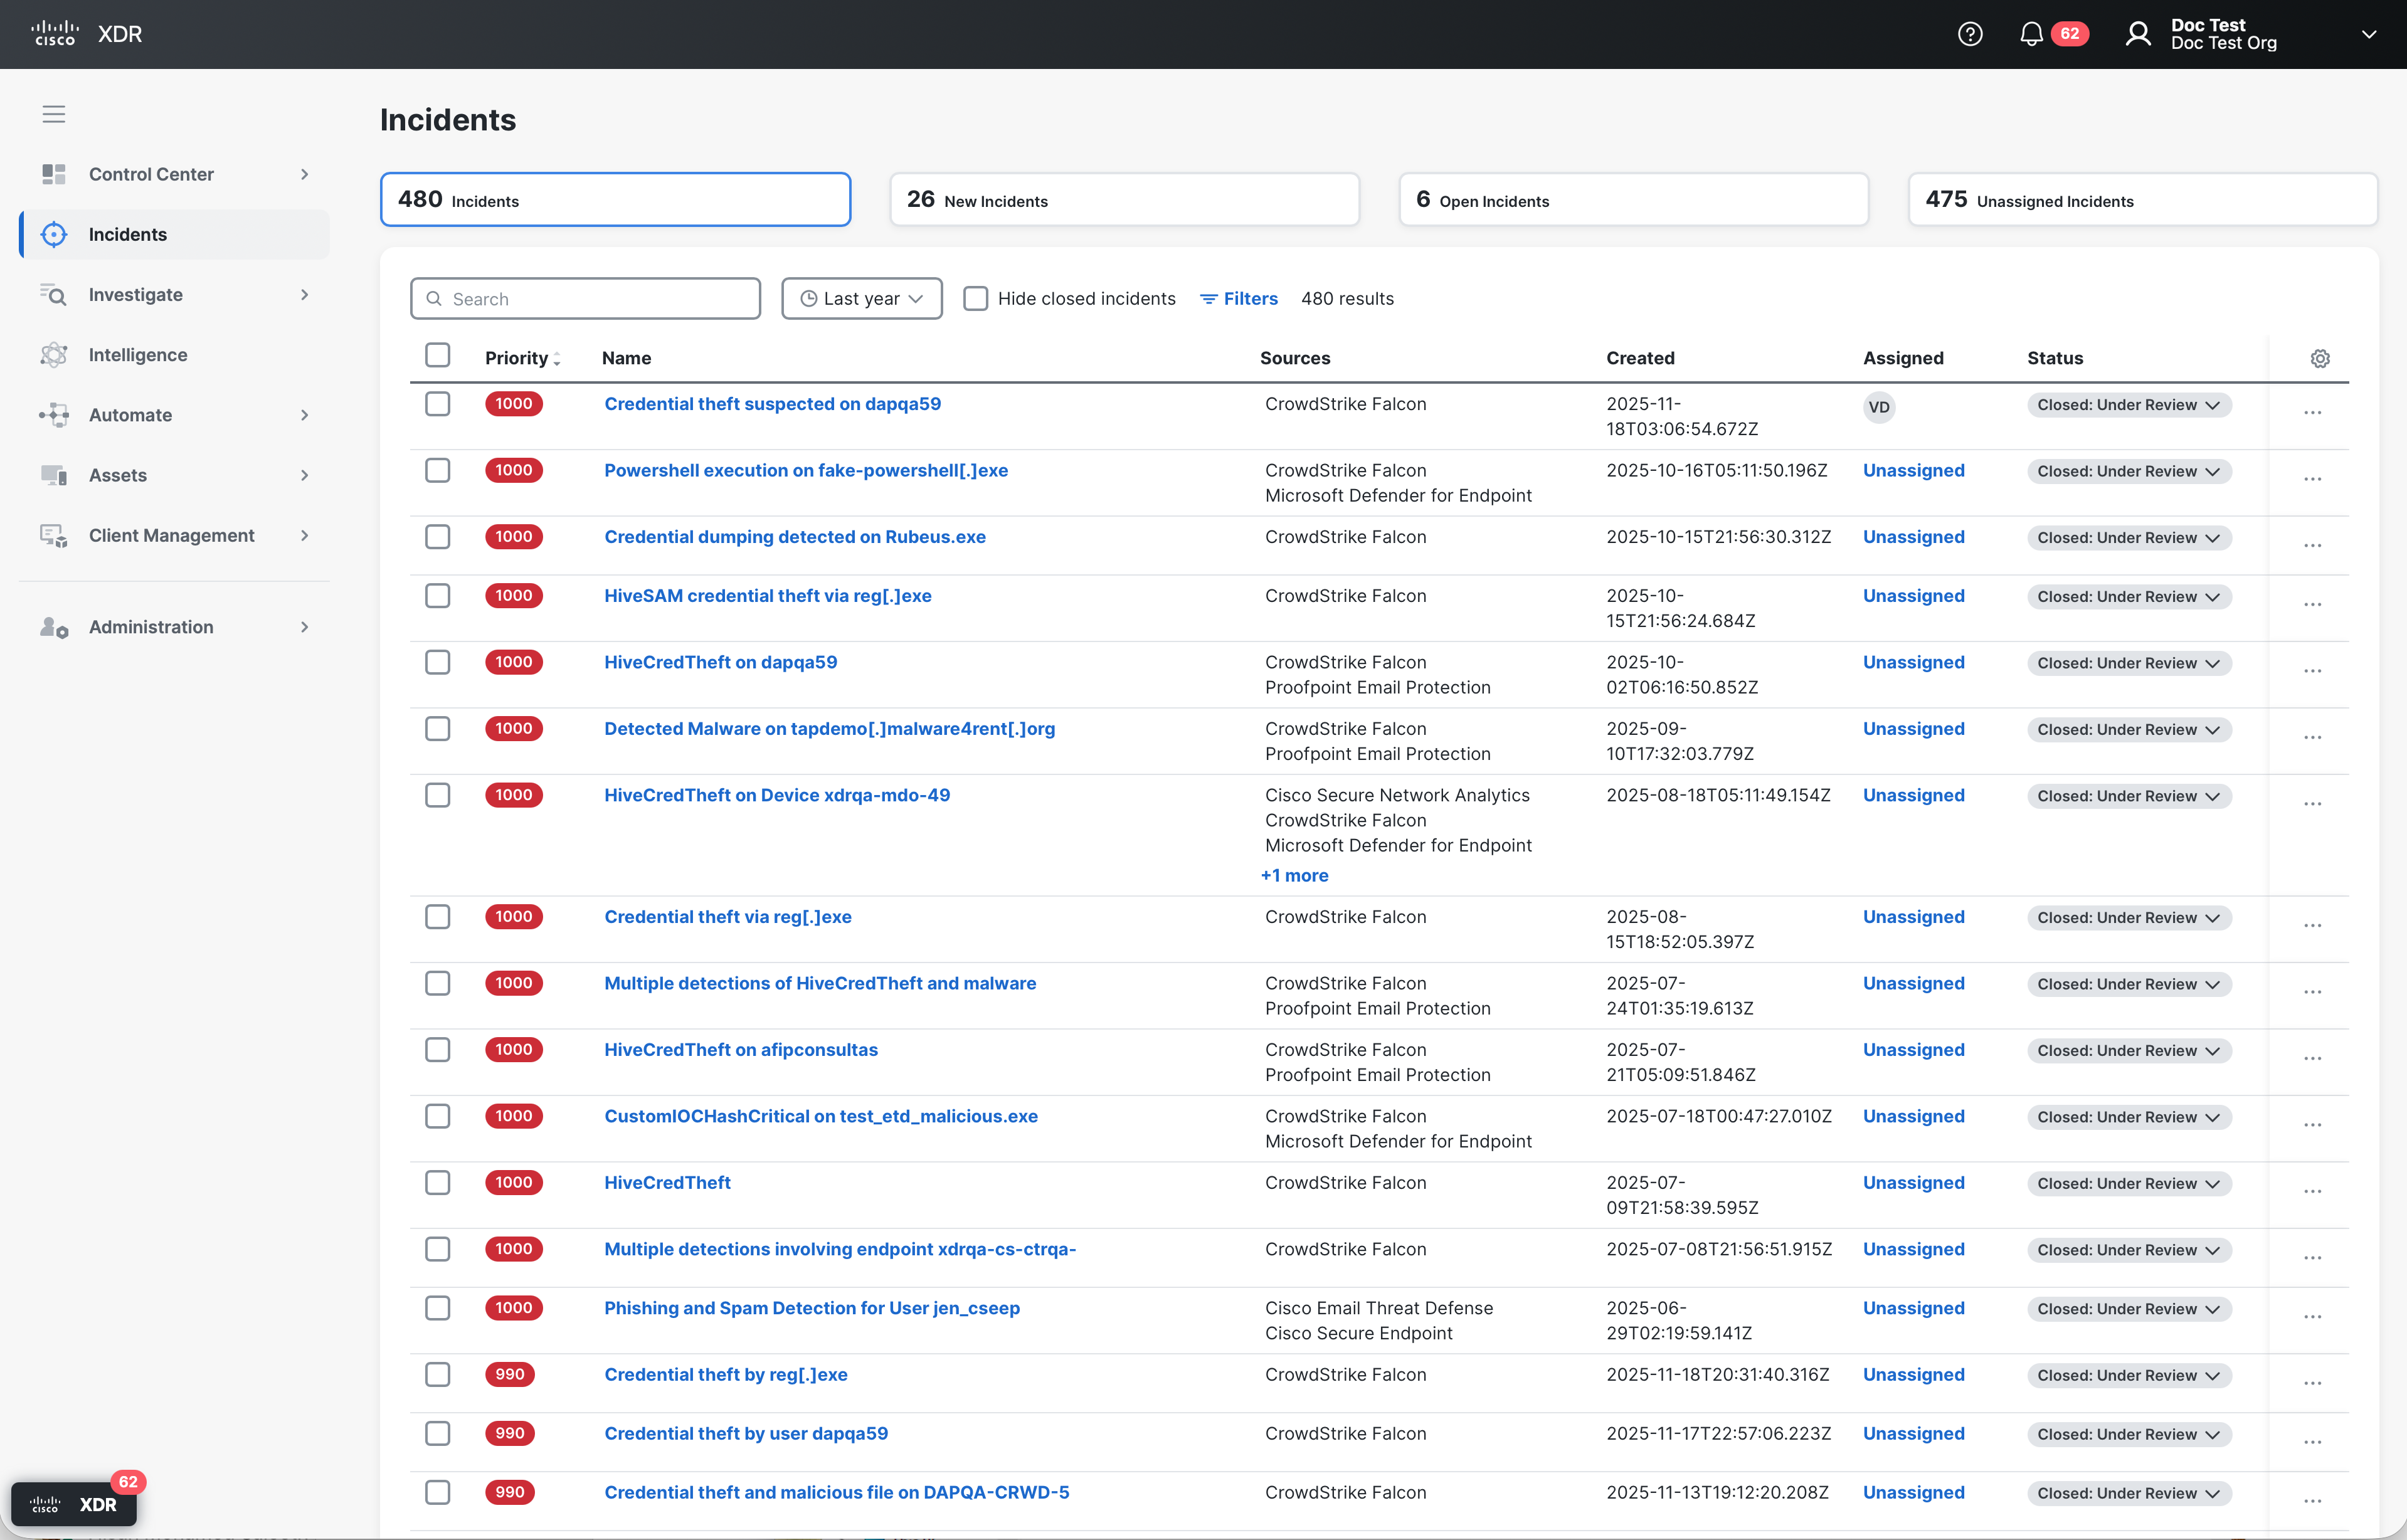
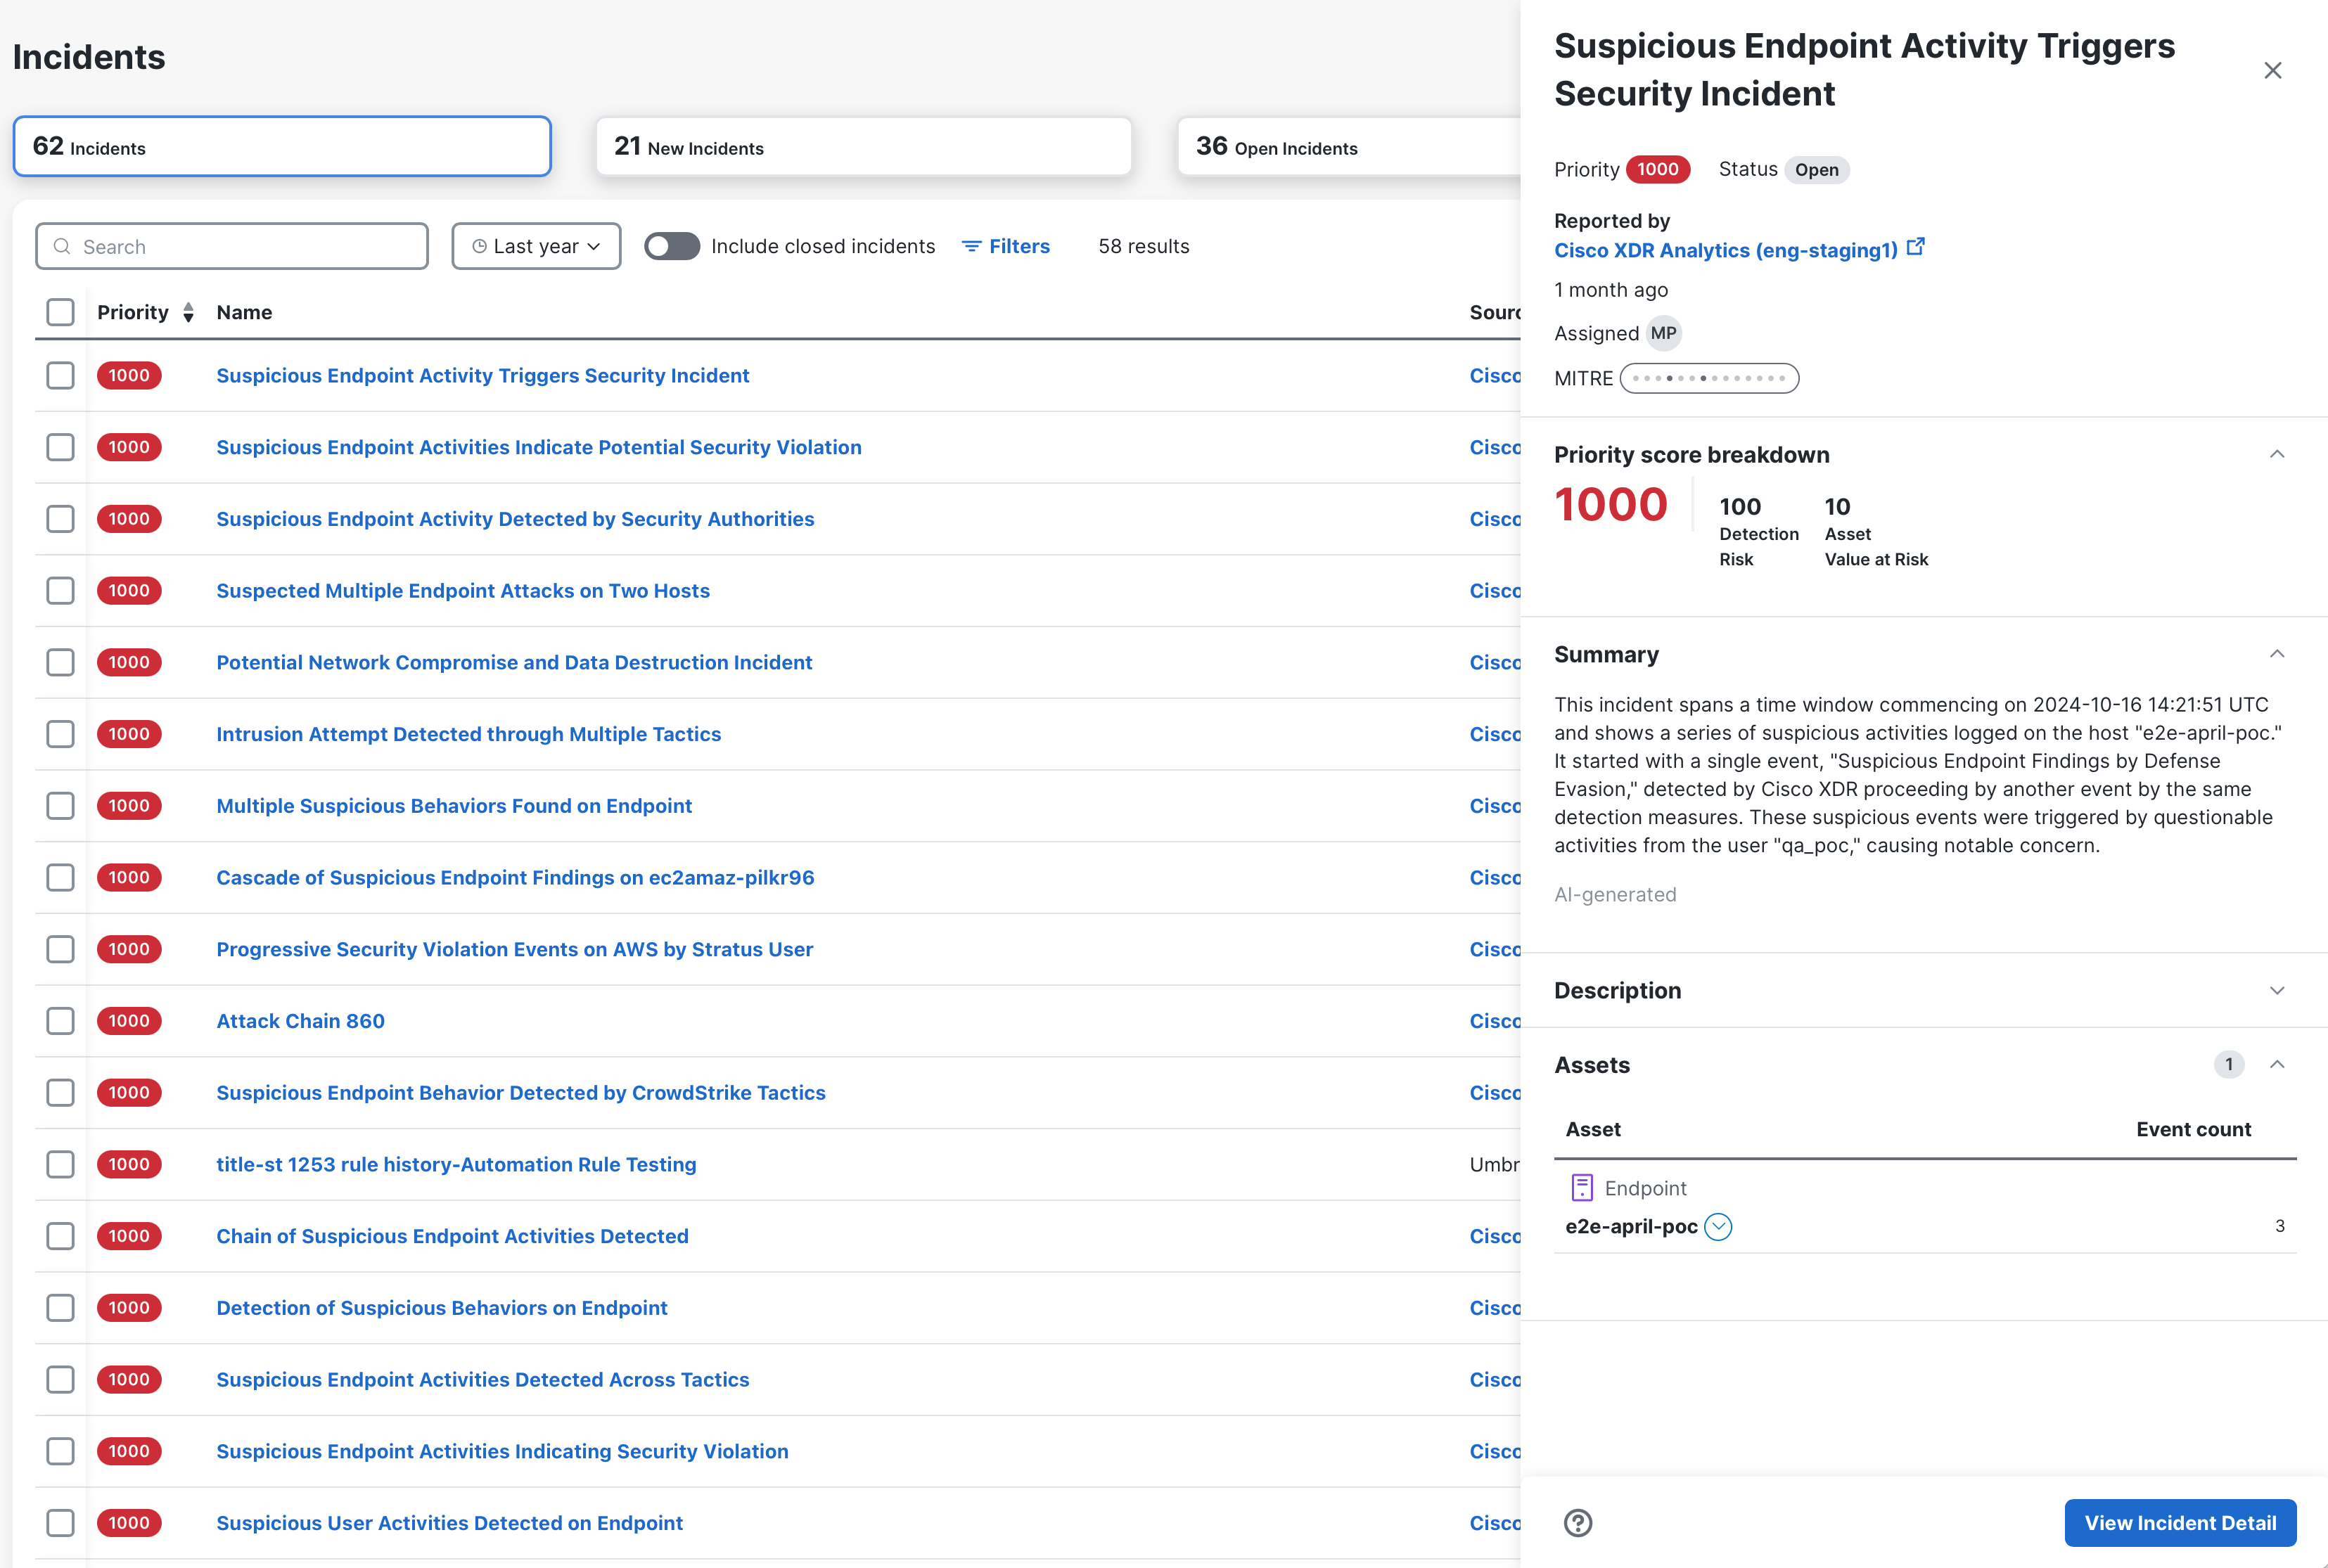
Click Incidents in the left menu to open the Incidents page and view the incidents that have been promoted to Cisco XDR. The incidents are sorted based on the priority score.
High-level summary metrics are displayed in the upper portion of the page that show the total number of Incidents, New Incidents, Open Incidents, and Unassigned Incidents. Click any of the cards to filter the list of incidents based on the category.
By default, incidents that are marked with any of the Closed statuses are hidden from the Incidents list. You can display closed incidents by unchecking the Hide closed incidents check box.
|
Column Name |
Description |
|---|---|
| Priority |
The overall priority score calculated from detection risk (including incident severity and TTP-based risk of financial loss) and asset value at risk (based on the value of assets involved in the incident). The priority score is color-coded based on the priority (see Color and Icon Key for more information). |
| Name | Name of the incident. |
| Sources | List of sources or products that contributed events to the incident. |
| Created | Date and time the incident was created. |
| Assigned | Full name of the user who has been assigned to the incident. |
| Status | The current incident status. You can click the drop-down list to change the existing status. For details, see Change Incident Status. |
|
Modified |
Date and time of the most recent incident data change, including status, assignee, name, user notes, or other content. This is an optional column that is only available in the Table settings drawer. For details, see Customize Columns. |
|
Tactics |
List of MITRE ATT&CK® tactic IDs impacting the incident. This is an optional column that is only available in the Table settings drawer. For details, see Customize Columns. |
|
Techniques |
List of MITRE ATT&CK® technique IDs impacting the incident. This is an optional column that is only available in the Table settings drawer. For details, see Customize Columns. |
|
Closed |
Date and time the incident status changed to any of the Closed statuses. This is an optional column that is only available in the Table settings drawer. For details, see Customize Columns. |
By default, the incidents are displayed in the list based on the priority score. You can search, filter, and sort the incidents to narrow the display to only those incidents you want to view.
You can scroll the list of incidents using the scroll bar on the page or the up and down arrow keys on your keyboard.
Enter the search criteria in the Search field to search for incidents by name, summary, description, or asset name. Search entries are not case sensitive. The incidents that match your search criteria are displayed in the list of incidents.
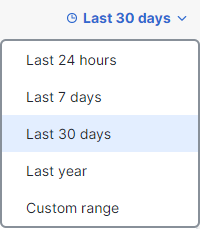
The incidents that are displayed in the list are those that have been promoted during the specified date range. By default, the list includes incidents promoted within the last 30 days. You can narrow the display of incidents based on a specific time frame using the Date Range menu above the Incidents list.
Click the Date Range drop-down menu and choose the date range for the incidents you want to be displayed:
- Last 24 hours - Displays incidents promoted within the last 24 hours that match the filter criteria.
- Last 7 days - Displays incidents promoted within the last 7 days that match the filter criteria.
- Last 30 days - Displays incidents promoted within the last 30 days that match the filter criteria. This is the default setting.
- Last Year - Displays incidents promoted within the last year that match the filter criteria. Incidents are only available for one year.
- Custom Range - Displays the incidents promoted within the specified start and end date, and that match the filter criteria.
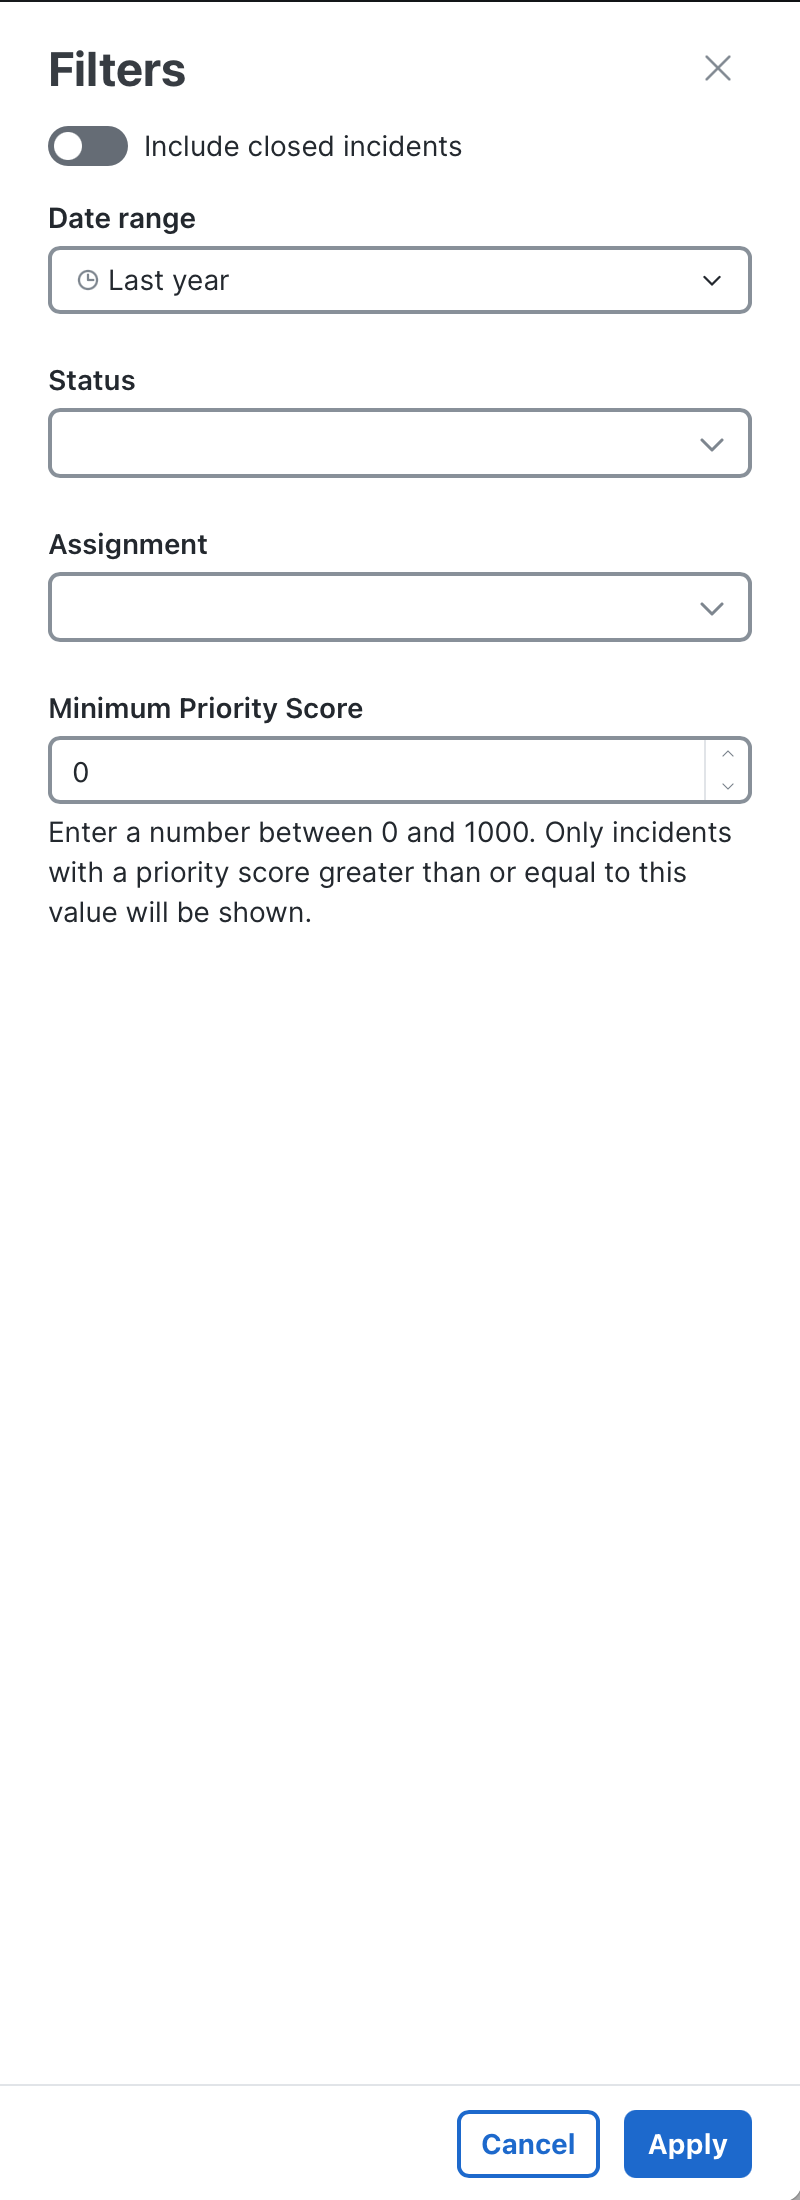
Filter the display of incidents based on date range, assignment, status, or priority score using the Filters drawer by clicking the ![]() (Filters) icon above the list of incidents or by clicking any of the filter buttons across the upper portion of the Incidents page (Incidents, New Incidents, Open Incidents, or Unassigned Incidents).
(Filters) icon above the list of incidents or by clicking any of the filter buttons across the upper portion of the Incidents page (Incidents, New Incidents, Open Incidents, or Unassigned Incidents).
Perform the following steps to use the Filters drawer to narrow the display of incidents by specific time frame, assignment, status, or priority score:
-
Click the
 (Filters) icon to open the Filters drawer.
 -
Configure the filter options below for those incidents you want to be displayed. The filter criteria is applied and the incidents list refreshes as you select the filter criteria.
-
Hide closed incidents - Uncheck the check box to display incidents with Closed statuses in the incidents list. By default, the check box is checked and closed incidents are hidden from display.
-
Date Range - Choose the date range for the incidents you want to be displayed. For more information, see Filter Incidents by Date Range.
-
Status - From the drop-down list, check the check boxes next to the status to filter the incidents displayed in the incidents list. Click the
 (Clear) icon to remove your selections.
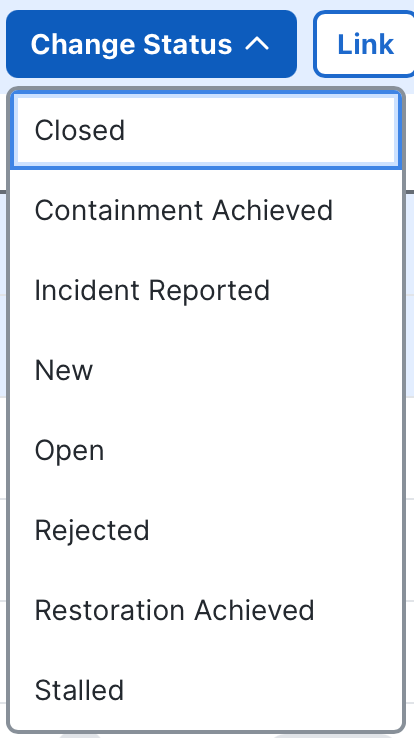
Note: For compatibility purposes, the following statuses are available in the Filters drawer only: Incident Reported, Open, Containment Achieved, Restoration Achieved, Stalled, Rejected, and Closed. You cannot set an incident to one of these statuses.
-
Assignment - From the drop-down list, check the check boxes next to the assignment values to filter the incidents displayed in the incidents list. If you do not choose an assignment value, all incidents with all assignment values are displayed in the list. Click the
 (Clear) icon to remove your selections.
 -
Minimum Priority Score - Enter a number between 0 and 1000 to display incidents equal to or greater than the specified priority score. Only incidents with a priority score greater than or equal to this value will be shown.
The Applied Filters area is displayed across the top of the incidents list. Click the
 (Expand) icon to display all the filter selections with the filter category and the filter tags. To remove a selected filter category, click the
  (Delete) icon or click the X in the filter tag to remove a specific selection within the filter category and the list will refresh.
 -
Click the (Sort) icon in the column headers in the Incidents table to sort the incidents by ascending or descending order, lowest to highest order, or alphabetically:
-
Priority - Sort the incidents by lowest to highest priority, or highest to lowest priority.
-
Name - Sort the incidents alphabetically.
-
Created - Sort the incidents by newest to oldest, or oldest to newest.
-
Status - Sort the incidents alphabetically by status.
-
Modified - If displayed, sort the incidents by newest to oldest, or oldest to newest.
You can reorder the columns in the table and select the columns displayed to customize the table for the data you want to view.
To reorder the table columns, click and drag a column header to the desired position in the table.
To resize a table column width, click the resize cursor in the column divider and drag it to the desired width.
Click the ![]() (Settings) icon to open the Display Settings drawer and check the check boxes next to the columns you want displayed in the incidents table. The
(Settings) icon to open the Display Settings drawer and check the check boxes next to the columns you want displayed in the incidents table. The ![]() (Lock) icon indicates that the column is mandatory and it is always displayed in the incidents table. You can reorder the columns by clicking the
(Lock) icon indicates that the column is mandatory and it is always displayed in the incidents table. You can reorder the columns by clicking the (Grabber) icon and dragging it to the desired position in the list.
If custom columns are displayed, click Reset to default to reset the table column settings to its default values.
The status of the incident shows where it is in its lifecycle. All incidents start out with a status of New, which indicates that they have been reported by a system but have not been confirmed. As the incidents are triaged, they can be moved to one of the Open statuses if deemed worthy of continuing an incident response process for the event. When finished, they can be set to one of the Closed statuses. Alternatively, an incident can be immediately closed if it is deemed to be inaccurate or uninteresting.
You can change the status of a single or multiple incidents from the Incidents page. You can also change the status of a specific incident from the header on the Incident Detail page.
| Status | Description |
|---|---|
|
New |
A new event received and detected by security tools. This status cannot be set by the user. |
|
New: Processing |
Automation rules are actively running and the incident is not ready for changes. This status cannot be set by the user. |
|
New: Presented |
A new event is presented to the customer and Automation is completed. |
|
Open: Investigating |
Active analysis is being conducted on the incident. |
|
Open: Reported |
Confirmation of incident and activity that is reportable. Investigation is completed and containment process has started. |
|
Open: Contained |
Confirmation of containment has completed. |
|
Open: Recovered |
Confirmation that eradication and recovery has completed. |
|
Hold: Internal |
Incident is on hold and it is active with an internal team. |
|
Hold: External |
Incident is on hold and it is active with an external team. |
|
Hold: Legal |
Incident is on hold and it is being reviewed by the legal team. The event should not be changed without advisory from the legal team. |
|
Closed: Under Review |
All necessary work has been completed with actions or lessons learned being performed. |
|
Closed: Confirmed Threat |
All necessary work has been completed with confirmation that the incident and activity are reportable. |
|
Closed: Suspected |
All necessary work has been completed and there is perceived violation with a lack in clear chain of evidence to prove the violation. |
|
Closed: False Positive |
No indication of a violation or reason for alert occurred, use case or rule may need tuning. |
|
Closed: Near-Miss |
Successful block or failed attempt to create an incident. The attacker failed to have any impact or exfiltration. |
|
Closed: Other |
All necessary work has been completed and the nature of the Closed status is undefined. |
|
Closed: Merged |
Incident was closed by the system as a duplicate incident and the content of the incident has been copied into another incident. This status cannot be set by the user. |
You can assign an incident to users from the Assigned column on the Incidents page or in the Assigned field in the header on the Incident Detail page.
If the incident has not yet been assigned, the Unassigned button is displayed. When the incident is assigned, an avatar with the user's initials is displayed and you can hover over the avatar to view the user's full name in a tooltip.
Note: If a user with an Incident Responder or Security Analyst role navigates to the Incident Detail page for an incident that is Unassigned and has a status of New, the incident is automatically assigned to the current user and the status is changed to Open.
-
Click the Unassigned button or any of the avatars in the Assigned column of the Incidents table.
-
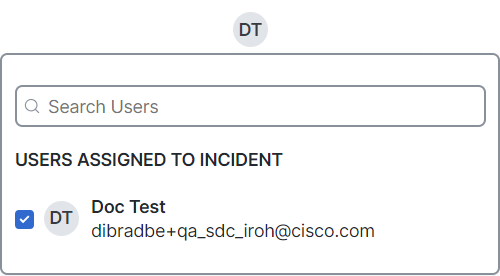
Check the check box next to the name in the list to assign the user to the incident. To remove an assignee, uncheck the check box next to their name.
-
Click Assign to apply your selection.
When an incident is assigned to another user, they will receive a notification in the
 (Notifications) icon in the Cisco XDR header and ribbon. For more information about this feature, see the Notifications help topic.
By default, the current user is automatically suggested at the top of the list. The list of users already assigned to incident is displayed with the check box checked in the Users Assigned To Incident area and all the users are listed in the Search Results area. Use the Search field to search for users by user name or email address to narrow down the users that are displayed in the Search Results area below. Search entries are not case-sensitive.
When you click an incident in the list, the Incident drawer opens where you can quickly understand the incident at a high level. You can scroll the list on the Incidents page using the up and down arrow keys on your keyboard. If the Incident drawer is open, the drawer is populated with information for the selected incident as you scroll.
The incident drawer shows the following information to gain a quick high-level understanding of the impact the incident may have and the necessary information to take immediate action:
Drawer Header
The upper portion of the drawer shows the following information about the incident:
|
Title |
The incident name that is displayed in the Incidents list is also displayed in the upper portion of the drawer. |
|
Priority |
The incident priority score is displayed in the uppermost portion of the incident drawer to give you immediate insight to the risk involved, and is color-coded based on the priority. The priority score is calculated from detection risk (including incident severity and TTP-based risk of financial loss) and asset value at risk (based on the value of assets involved in the incident). |
|
Status |
The current state of the incident and where it stands in regards to remediation. For more information, see Change Incident Status. |
|
Reported by |
The source or product that reported the incident and the date and time the incident was created. Click the source link to open the event in the originating product. |
|
Assigned |
Shows who has been assigned to the incident. Hover over the avatar to view the full user name. You cannot assign users to the incident from this field. For more information, see Assign Incident. |
|
MITRE |
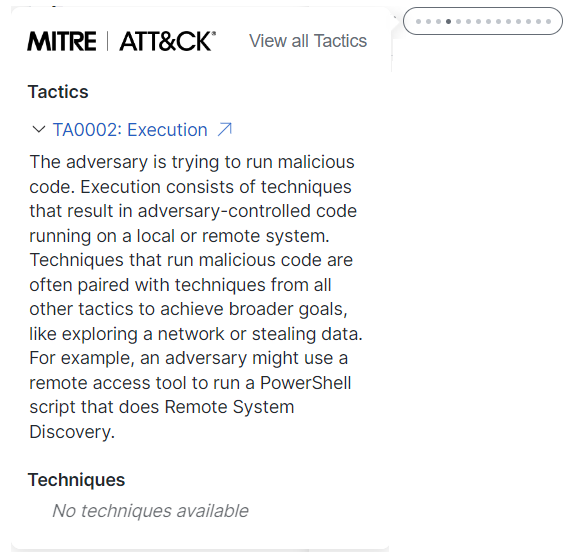
The MITRE tactic tag shows the MITRE ATT&CK® tactics impacting the incident based on the Financial Risk Score, which indicates the probability of financial impact if the MITRE ATT&CK® patterns are not mitigated—the higher the score, the higher the probability of impact. If there are two or more tactics impacting the incident, the number of tactics is also displayed in the MITRE tactic tag. Click the MITRE tactic tag to view the MITRE Tactic popup showing a list of specific MITRE ATT&CK tactics and techniques impacting the incident. The MITRE ATT&CK Coverage Map link opens the MITRE ATT&CK Coverage Map page. For details, see MITRE ATT&CK Coverage Map. Note: The No MITRE TTPs found tag is only displayed if there are MITRE TTP data indicated in the incident. Click the Click View events to view all events related to the incident on the Detections tab in the incident detail. For details, see Detection. |
Priority Score Breakdown
The Priority score breakdown panel is expanded by default and it displays how the priority score was calculated from Detection Risk (including incident severity and TTP-based risk of financial loss) and Asset Value at Risk (based on the value of assets involved in the incident).
Sources
The Sources panel is expanded by default and it displays a list of sources or products that contributed events to the incident.
Summary
The Summary panel is expanded by default and it displays the summary of the incident. The information varies depending on the reporting product.
The AI-generated label is displayed at the end of the summary if the summary was generated by AI.
Description
Expand the Description panel and view the metadata included in the description of the incident, such as Urgency, Event time, Promoted at (time), Reporting Device Type and ID, Security Intelligence Event and Category, and Promoting Reason. The Long Description will vary depending on the reporting product.
The AI-generated label is displayed at the end of description if the description was generated by AI.
Assets
The Assets panel is expanded by default and it displays the total number of unique assets through all of the events related to the selected incident. These are the same assets that are displayed in the Assets drawer on this page and on the Overview tab in the incident detail.
The assets are represented by an icon that allows you to easily distinguish the asset type.
Each asset includes a ![]() (Pivot Menu) icon that enables you to take action on it. You can perform some actions directly in the Pivot menu or pivot to the integrated product to perform additional actions.
(Pivot Menu) icon that enables you to take action on it. You can perform some actions directly in the Pivot menu or pivot to the integrated product to perform additional actions.
View Incident Detail
To view more information about the incident, click View Incident Detail in the lower portion of the drawer to open the Incident Detail page, which includes an overview of the incident, event data associated with it, response actions, and a work log. For more information, see the Incident Detail help topic.
To close the drawer, click the (Close) icon in the upper right corner.
Linking incidents improves overall incident management by aggregating relevant incidents to create a bi-directional relationship between them, which helps streamline the incident response workflow. You can link two or more incidents. After incidents are linked, you can view the relationship between these incidents in the Linked Incidents drawer in the incident detail. You can also unlink incidents from the drawer.
Perform the following steps to link incidents:
-
In the Incidents list, check the check boxes next to the incidents you want to link. Use the Filters drawer and Date Range menu to narrow the display of incidents.
-
Click Link in the bulk action bar. The incidents are linked and displayed in the header and Linked Incident drawer in the incident detail.
For more information, see the Incident Detail help topic.
You can delete a single incident or multiple incidents that are displayed on the Incidents page.
Note: Deleting incidents is permanent and cannot be undone.
-
In the Incidents list, check the check boxes next to the incidents you want to delete. Use the Filters drawer and Date Range menu to narrow the display of incidents.
-
Click Delete in the bulk action bar.
-
On the Confirm Delete dialog box, click Delete to confirm the deletion.
A success message is displayed in the lower right corner of the screen and the screen is refreshed with the incident removed.
To delete a single incident in the Incidents list, click the ![]() (Ellipsis) icon for the incident you want to delete and choose Delete incident.
(Ellipsis) icon for the incident you want to delete and choose Delete incident.
You can download an incident in JSON format to your computer on the Incidents page. In the Incidents list, click the ![]() (Ellipsis) icon for the incident you want to export and choose Download JSON.
(Ellipsis) icon for the incident you want to export and choose Download JSON.
The incident and its related data is downloaded as a JSON file. You can then attach the raw file to an internal incident report or case file.
