Detections
The Detections page displays all the security events generated by integrated products and the Cisco XDR native telemetry sent from the following sources: Network, Cloud, Identity, and Endpoint. The detections allow you to validate the data that is ingested by Cisco XDR for incident correlation. For details on how the detections are grouped and enriched by the correlation engine in Cisco XDR to create incidents in Cisco XDR, see Detection. You can also create custom detections using the Findings Intake API. For more information, see Cisco Developer - Cisco XDR API Documentation.
The following is a list of supported Cisco and third-party products that generate detections if integrated in Cisco XDR:
-
Detections from the Secure Email Threat Defense (India) integration in the Asia Pacific, Japan, China region and the Secure Email Threat Defense (UAE) integration in the Europe region are not supported in Cisco XDR.
-
If Cisco Secure Endpoint does not provide network interfaces, device correlation is impacted and these Secure Endpoint detections may not be part of an incident. To resolve this issue, we recommend that you upgrade Secure Endpoint to the following agent versions that report detailed device information for detections originating on the endpoint:
-
Windows: 8.4.4 or later
-
Mac: 1.26.0.1010 or later
-
Linux: 1.26.0.1177 or later
-
The Cisco and third-party integrations are configured on the Integrations page. For details on adding an integration, see Integrations.
The Cisco XDR source refers to the Cisco XDR native telemetry sent from endpoint and the following sources that are integrated in Secure Cloud Analytics: network, cloud, and identity. For more information, see Secure Cloud Analytics. The Network Visibility Module data is sent to Cisco XDR from the endpoint source if you install the default deployment on your endpoints. For more information on installing the default deployment and viewing endpoints data, see Default Deployments.
You can filter the types of detections to narrow the list of results in the table.
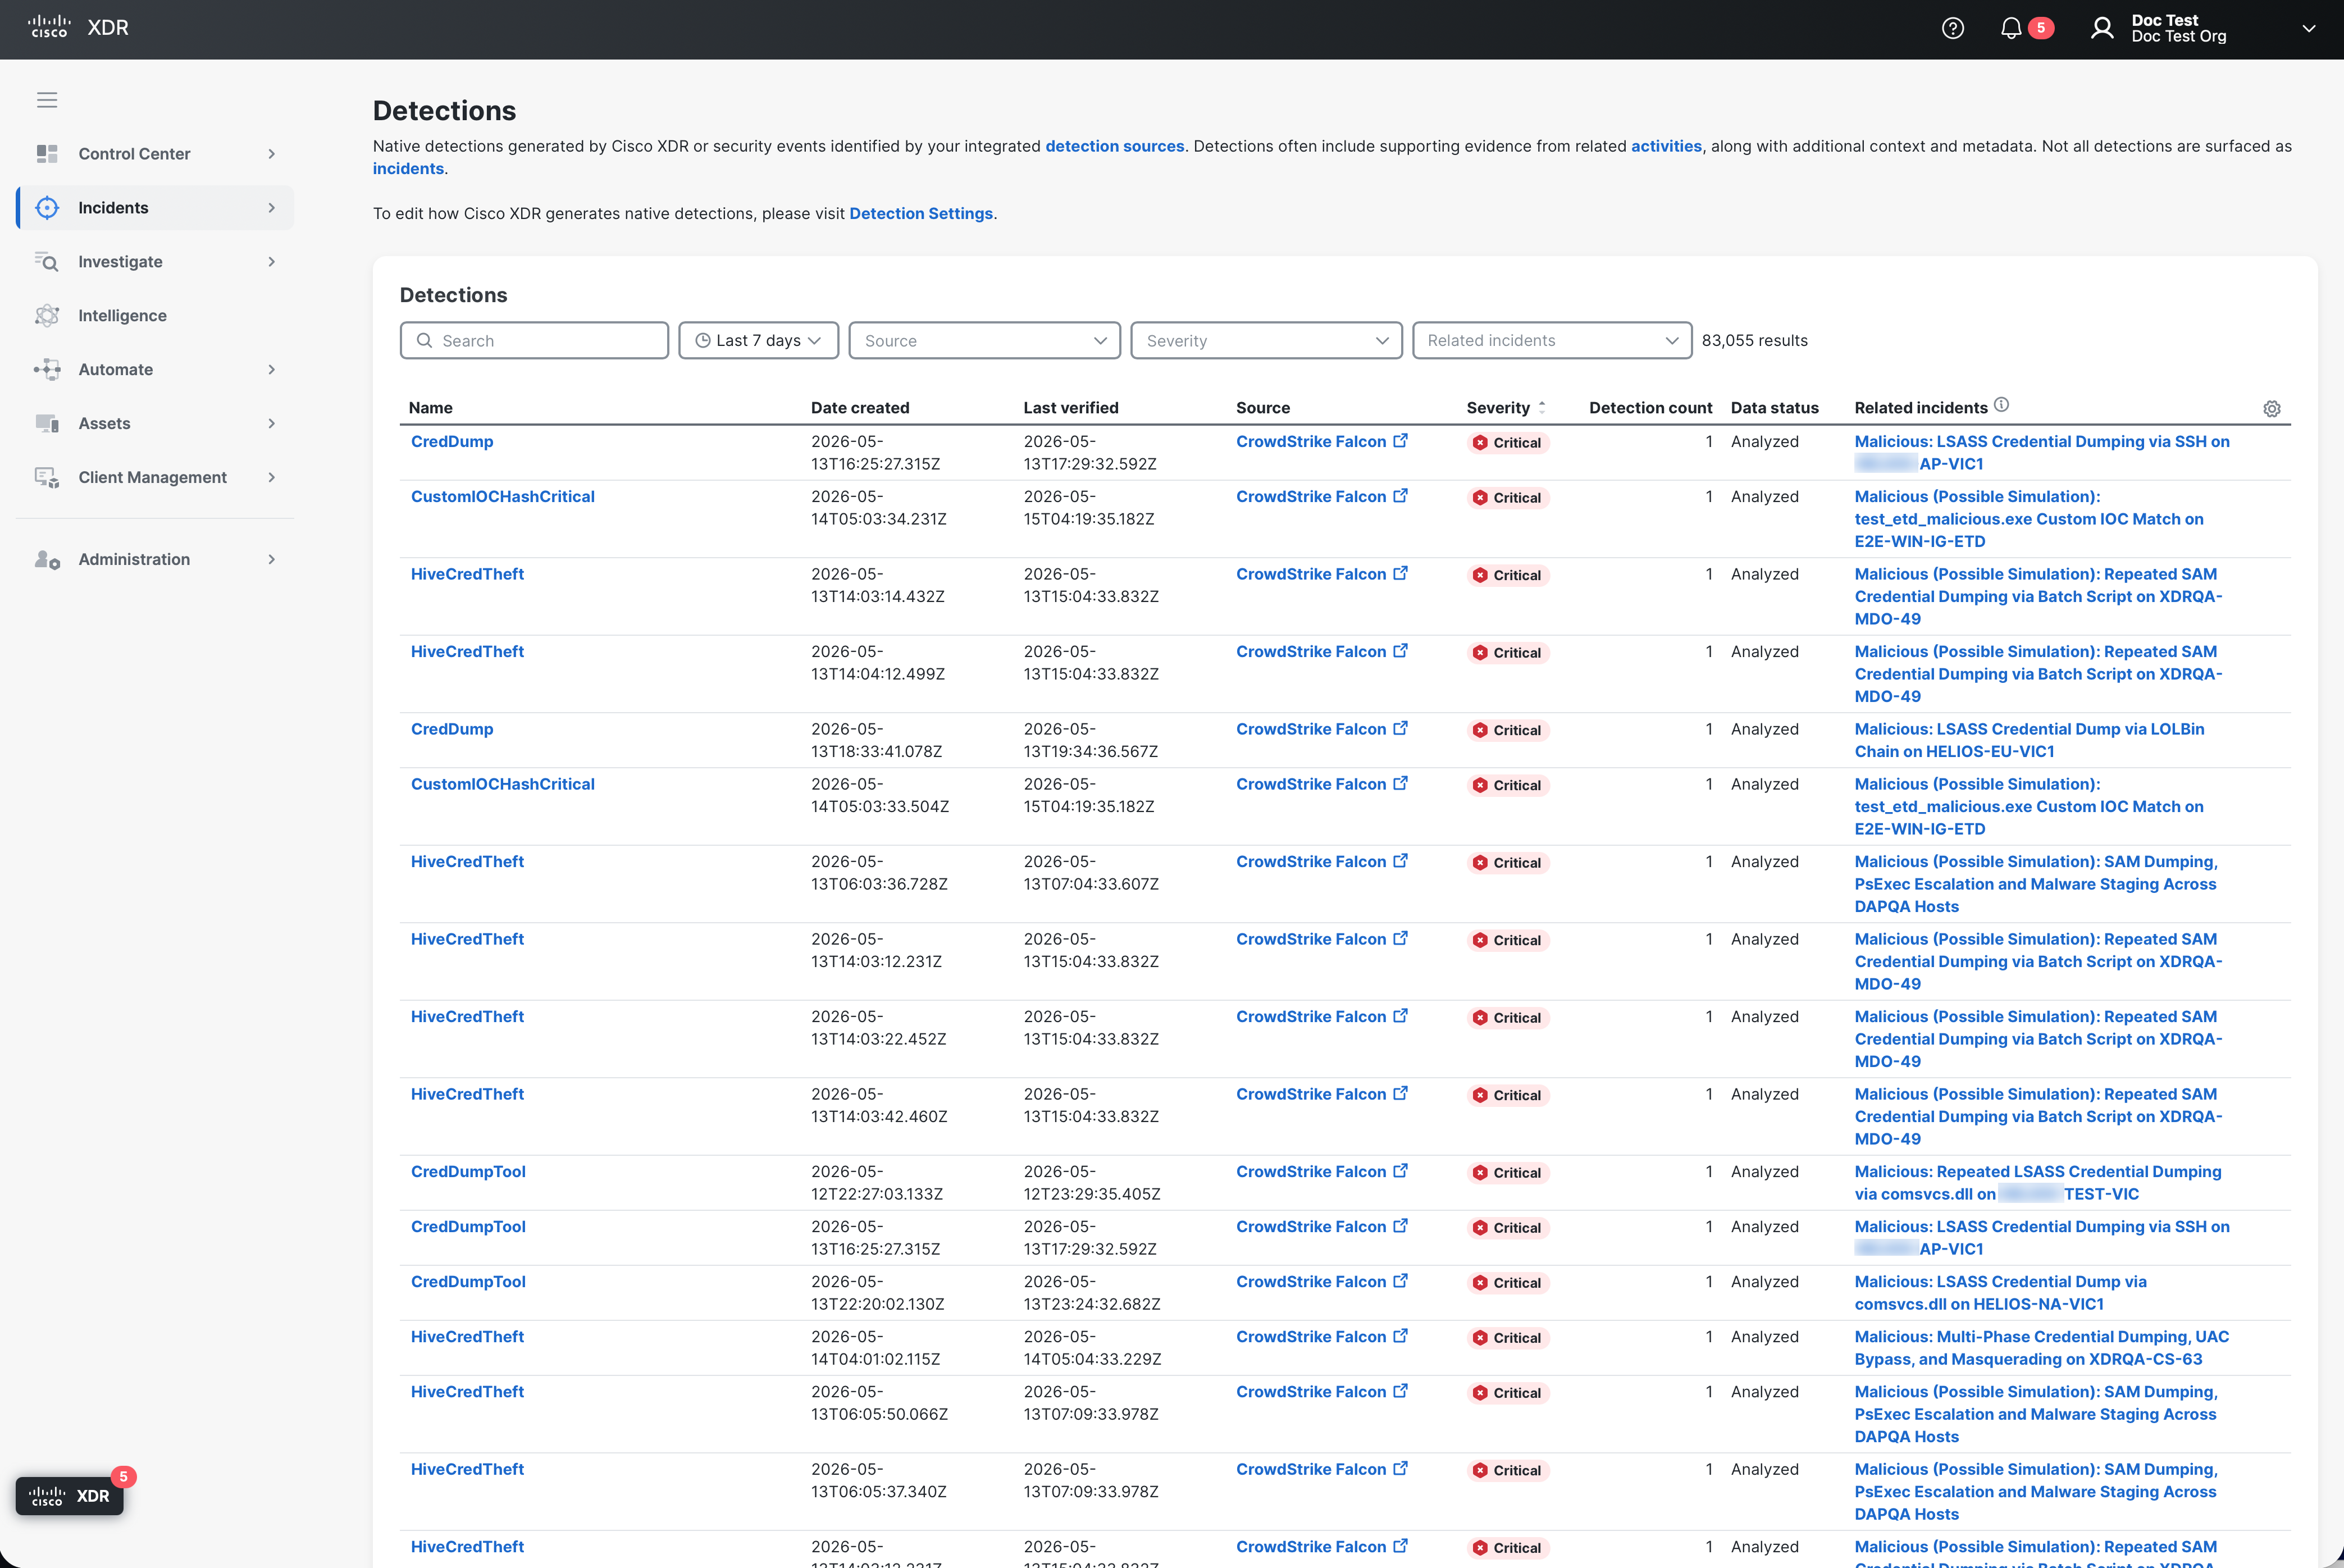
Choose Incidents > Detections in the navigation menu to view the detections from Cisco XDR native sources and integrated products.
Note: The detections table displays the first 10,000 detections only.
 Detections Table Column Descriptions
|
Column Name |
Description |
|---|---|
|
Name |
Name of the detection. |
|
Date created |
Date and time the detection was created by the source. |
|
Last verified |
Date and time the detection was last processed by Cisco XDR. |
|
Source |
Name of the integrated product that generated the detection. Click the source link to open the detection in the integrated product. |
|
Severity |
Threat level of the detection (Critical, High, Medium, Low, Informational, Unknown). |
|
Incident action |
Determines how the detection contributes to incident creation under the applied incident tuning rule:
The Default tag is displayed when no incident tuning rule matches this detection. Cisco XDR creates an incident if the default promotion rules are met. For more information on incident tuning rules, see Incident Tuning. |
| Detection count | Number of detections derived from the security event. |
| Data status | Status of whether the detection has been analyzed by Cisco XDR for incident correlation. |
|
Related incidents |
Displays all the current incidents that contain the detection. Click the incident link to open the incident detail in a new tab. For more information on incidents, see Incidents.
|
|
Source details |
Instance name provided by the user when configuring the integrated product that generated the detection. This is an optional column that is only available in the Table settings drawer. For details, see Customize Columns. |
Search, Filter and Sort Detections
You can search and filter the detections to narrow the display to only those detections you want to view.
Search Detections
Use the Search field in the upper portion of the page to narrow down the display of detections. The search is triggered as you enter the criteria. You can search for detections by partial or complete name. Search entries are not case sensitive.
Filter by Date
The detections that are displayed in the list are those that have been created within the specified date range, subject to your data retention policy. By default, the list includes security events created within the last 7 days. You can narrow the display of security events based on a specific timeframe using the date created drop-down menu above the detections list.
Click the date created drop-down list and choose the date range for the detections you want to display:
-
Last 24 hours - Displays detections created within the last 24 hours that match the filter criteria.
-
Last 7 days - Displays detections created within the last 7 days that match the filter criteria.
-
Last 30 days - Displays detections created within the last 30 days that match the filter criteria.
-
Last year - Displays detections created within the last year that match the filter criteria.
-
Custom range - Displays detections created within the specified start and end date, and that match the filter criteria.
The date range selected is displayed in the Applied Filters area. Click the  (Expand) icon to display all the filter selections with the filter category and the filter tags. To remove a selected filter category, click the
  (Delete) icon or click the X in the filter tag to remove a specific selection within the filter category and the list will refresh.
Alternatively, click the  (Filters) icon to open the Filters drawer to choose the timeframe from the Date created drop-down list. The filter criteria is applied and the detections list refreshes as you select the filter criteria.
Filter by Source
The Source menu allows you to filter the detections that were created from Secure Cloud Analytics (native sources) and integrated products. All sources are automatically shown by default.
Click the Source drop-down list and check the check boxes next to the product sources to filter the detections displayed. When you select a single source in the filter, the name of the source is displayed in the Applied Filters area. Click the (Expand) icon to display all the filter selections with the filter category and the filter tags. To remove a selected filter category, click the (Delete) icon or click the X in the filter tag to remove a specific selection within the filter category and the list will refresh.
The number of selections is always visible next to Source in the drop-down menu. Click the  (Clear) icon to remove your selections.
Alternatively, click the (Filters) icon to open the Filters drawer to choose the product sources from the Source drop-down list. The filter criteria is applied and the detections list refreshes as you select the filter criteria.
Filter by Severity
The Severity menu allows you display detections based on the severity level (Critical, High, Medium, Low, Informational, Unknown). Click the Severity drop-down list and choose the severity level of the detections you want displayed in the list.
Alternatively, click the (Filters) icon to open the Filters drawer to choose the severity level from the Severity drop-down list. The filter criteria is applied and the detections list refreshes as you select the filter criteria.
Filter by Incident Action
The Incident action menu allows you to display detections based on how a matching incident tuning rule affects a detection during incident creation (Exclude, Context, Promote). Click the Incident action drop-down list and choose the incident tuning rule action for the detections you want displayed in the list.
Alternatively, click the (Filters) icon to open the Filters drawer to choose the incident action from the Incident action drop-down list. The filter criteria is applied and the detections list refreshes as you select the filter criteria.
Filter by Related Incidents
Click the Related incidents drop-down list and choose With related incidents to only display detections that have related incidents in the list or Without related incidents to only display detections that do not have any related incidents in the list.
Alternatively, click the (Filters) icon to open the Filters drawer to choose the related incidents from the Related incidents drop-down list. The filter criteria is applied and the detections list refreshes as you select the filter criteria.
Sort Detections
Click the  (Sort) icon in the column headers in the Detections table to sort the detections by ascending or descending order, or alphabetically.
Reorder and Customize Columns
You can reorder the columns in the table and select the columns displayed to customize the table for the data you want to view.
Reorder Columns
To reorder the table columns, click and drag a column header to the desired position in the table.
Customize Columns
Click the  (Settings) icon to open the Table Settings drawer and check the check boxes next to the columns you want displayed in the Detections table and click Apply. If custom columns are displayed, click Reset to defaults to reset the table column settings to its default values.
View Detection Details in Drawer
When you click a detection in the list, the Detections drawer opens where you can quickly view the detections and related activities derived from the detections. The detection details are displayed using the Industry Standard Open Cybersecurity Schema Framework (OCSF), version 1.4. For details, see Open Cybersecurity Schema Framework.
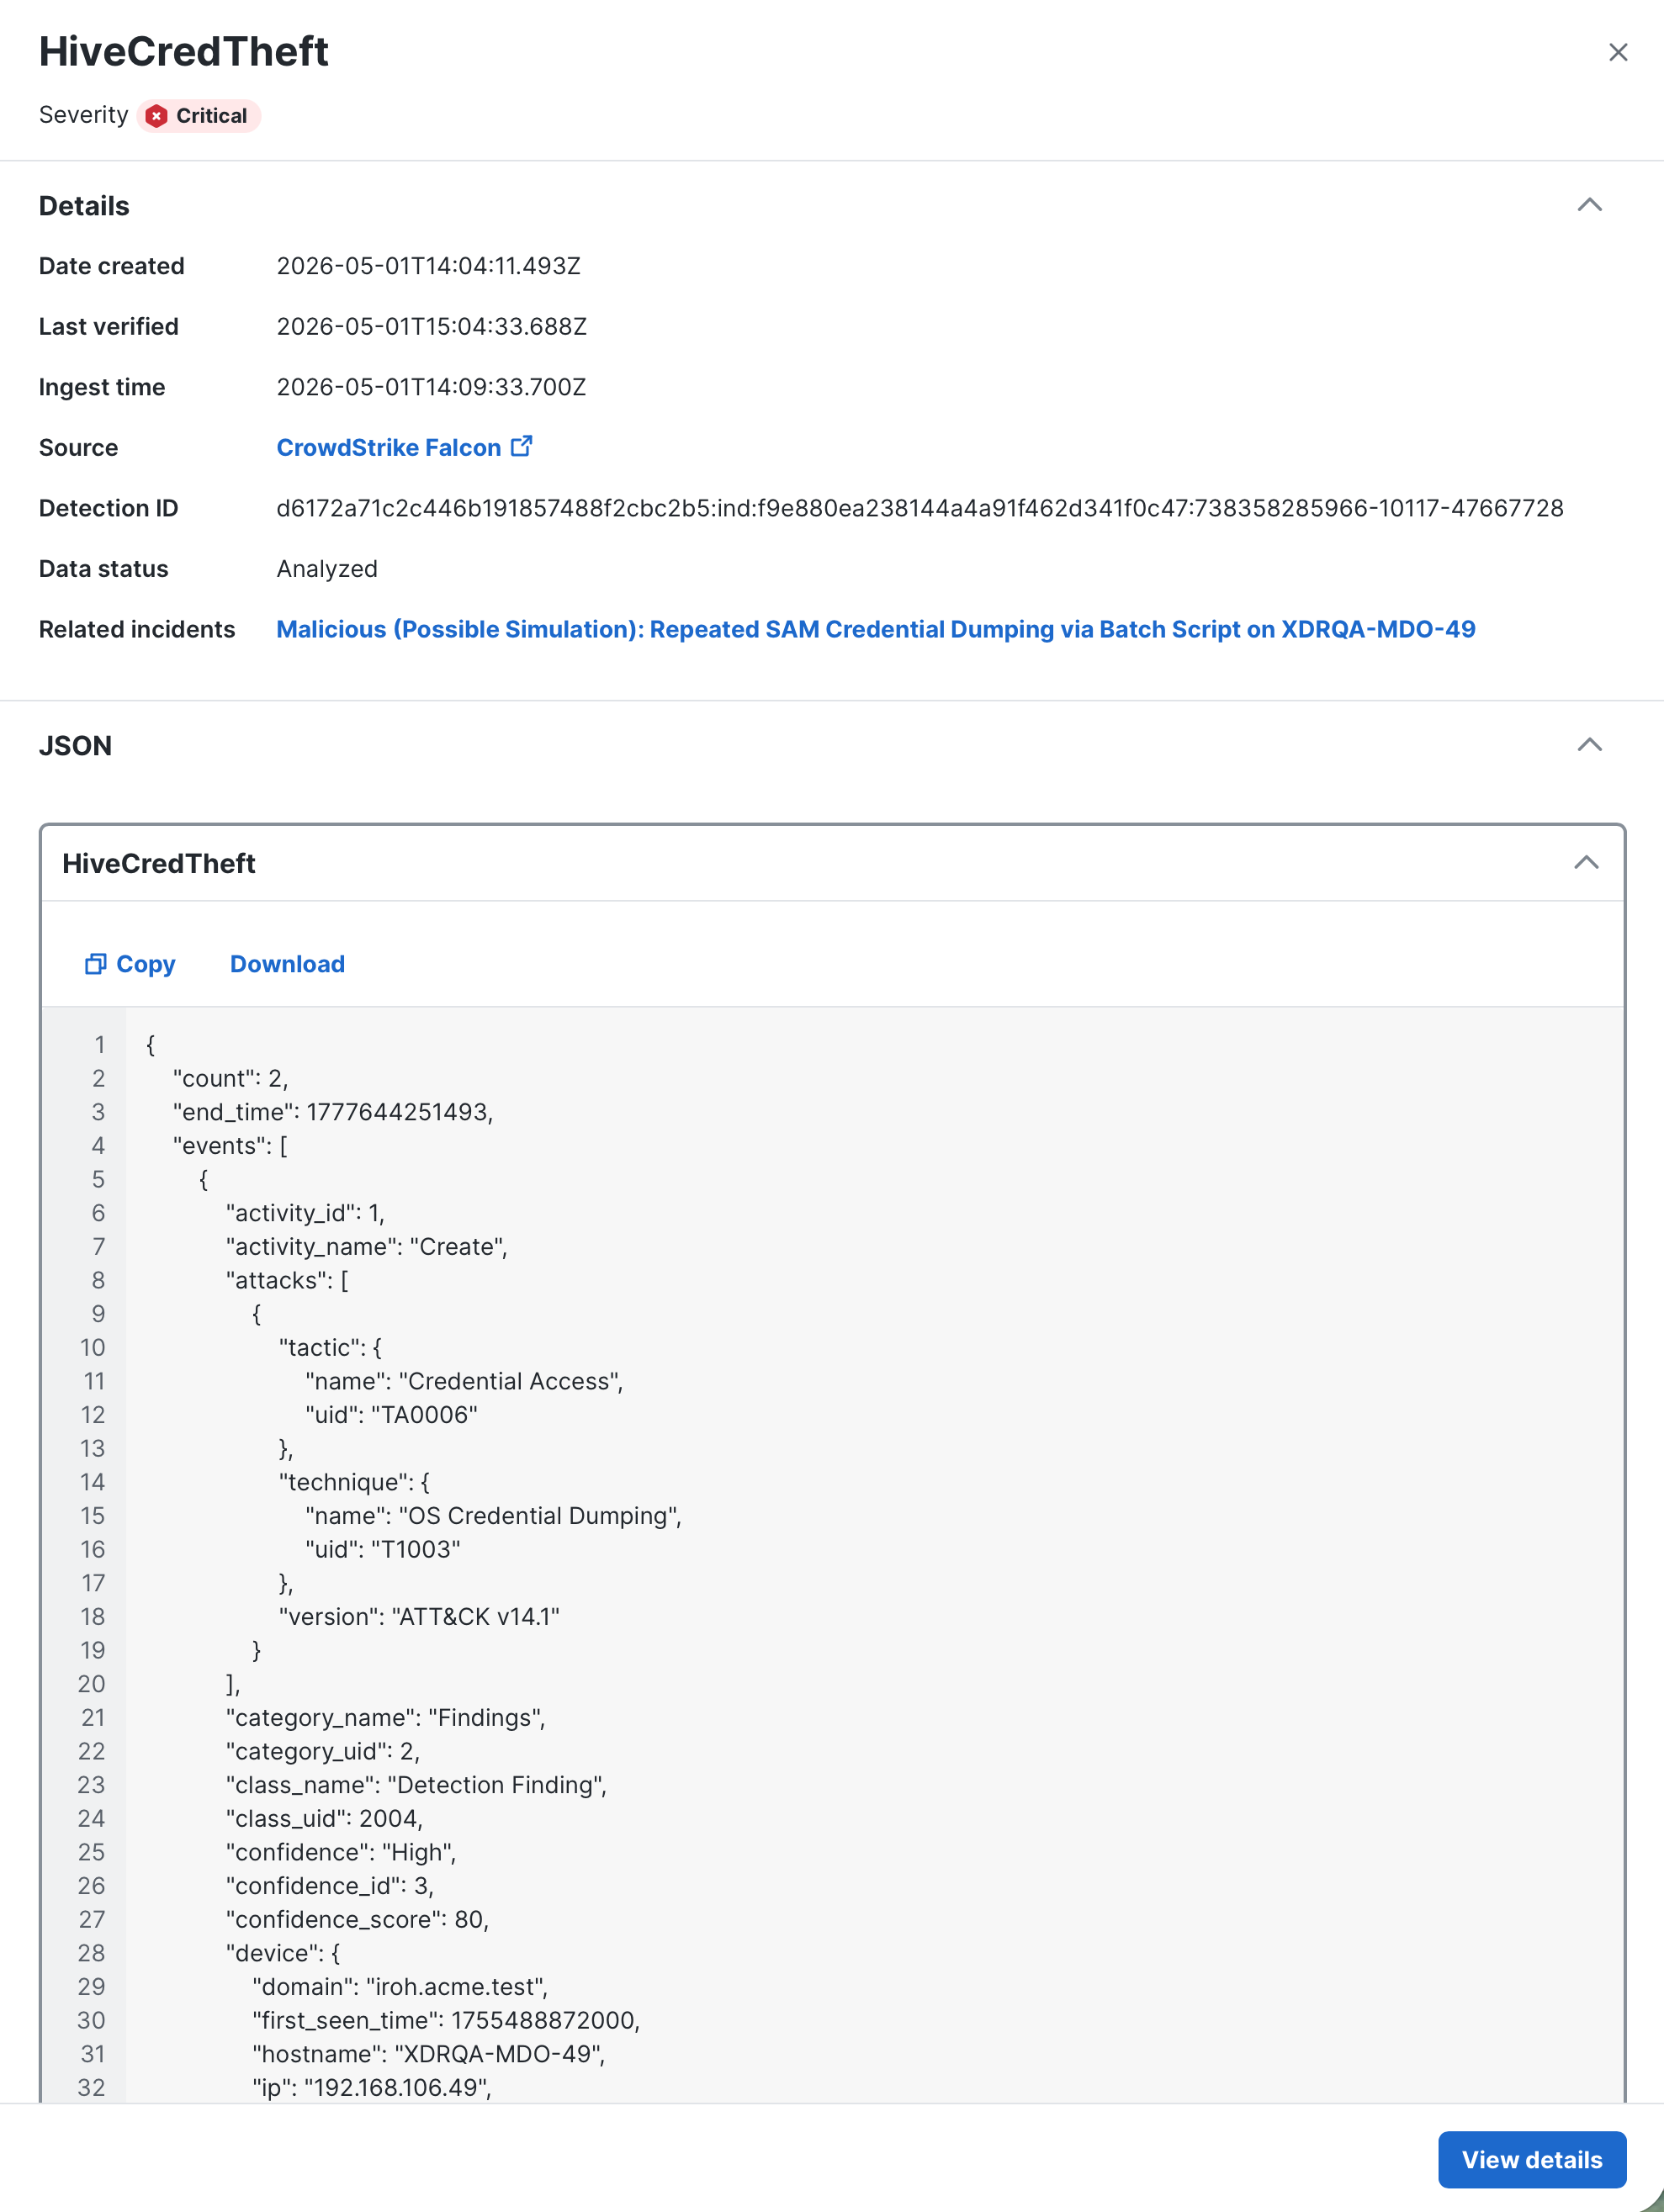
Detection Details Drawer Information
|
Date created |
Date and time the detection was created by the source. |
|
Last verified |
Date and time the detection was last processed by Cisco XDR. |
|
Ingest time |
Date and time the detection was first received by Cisco XDR. |
|
Source |
Name of the source product that generated the detection. Click the source link to open the detection in the integrated product. |
|
Detection ID |
A unique identifier provided by the source for the detection. |
|
Data status |
Status of whether the event has been analyzed by Cisco XDR for incident correlation. |
|
Related incidents |
Displays all the current incidents that contain the detection. Click the incident link to open the incident detail in a new tab. For more information on incidents, see Incidents. The None status is displayed if there are no incidents associated with the detection, and the Not available status is displayed if the related incidents cannot be determined due to the detection being generated prior to the related incidents feature support (September 25th, 2025). |
|
JSON |
Expand the JSON panel to display the detection and related activities in JSON format. If applicable, the JSON panel may display multiple detections. Expand a detection to display the detection and related activities in JSON format. You can search for keywords in the Search field, with Case Sensitive, Regular Expression, and Whole Word options available to refine the search. Click Download or Copy to download or copy the detection and related activities displayed in JSON format. Click View details to open the detection details page with additional information, such as description, risk level, and the MITRE ATT&CK tactics and techniques used by the detection, and related activities as supporting evidence for the detection. For more information, see View Detection Details. |
View Detection Details
Click View details in the detection details drawer to open the detection details page with additional information on the detection.
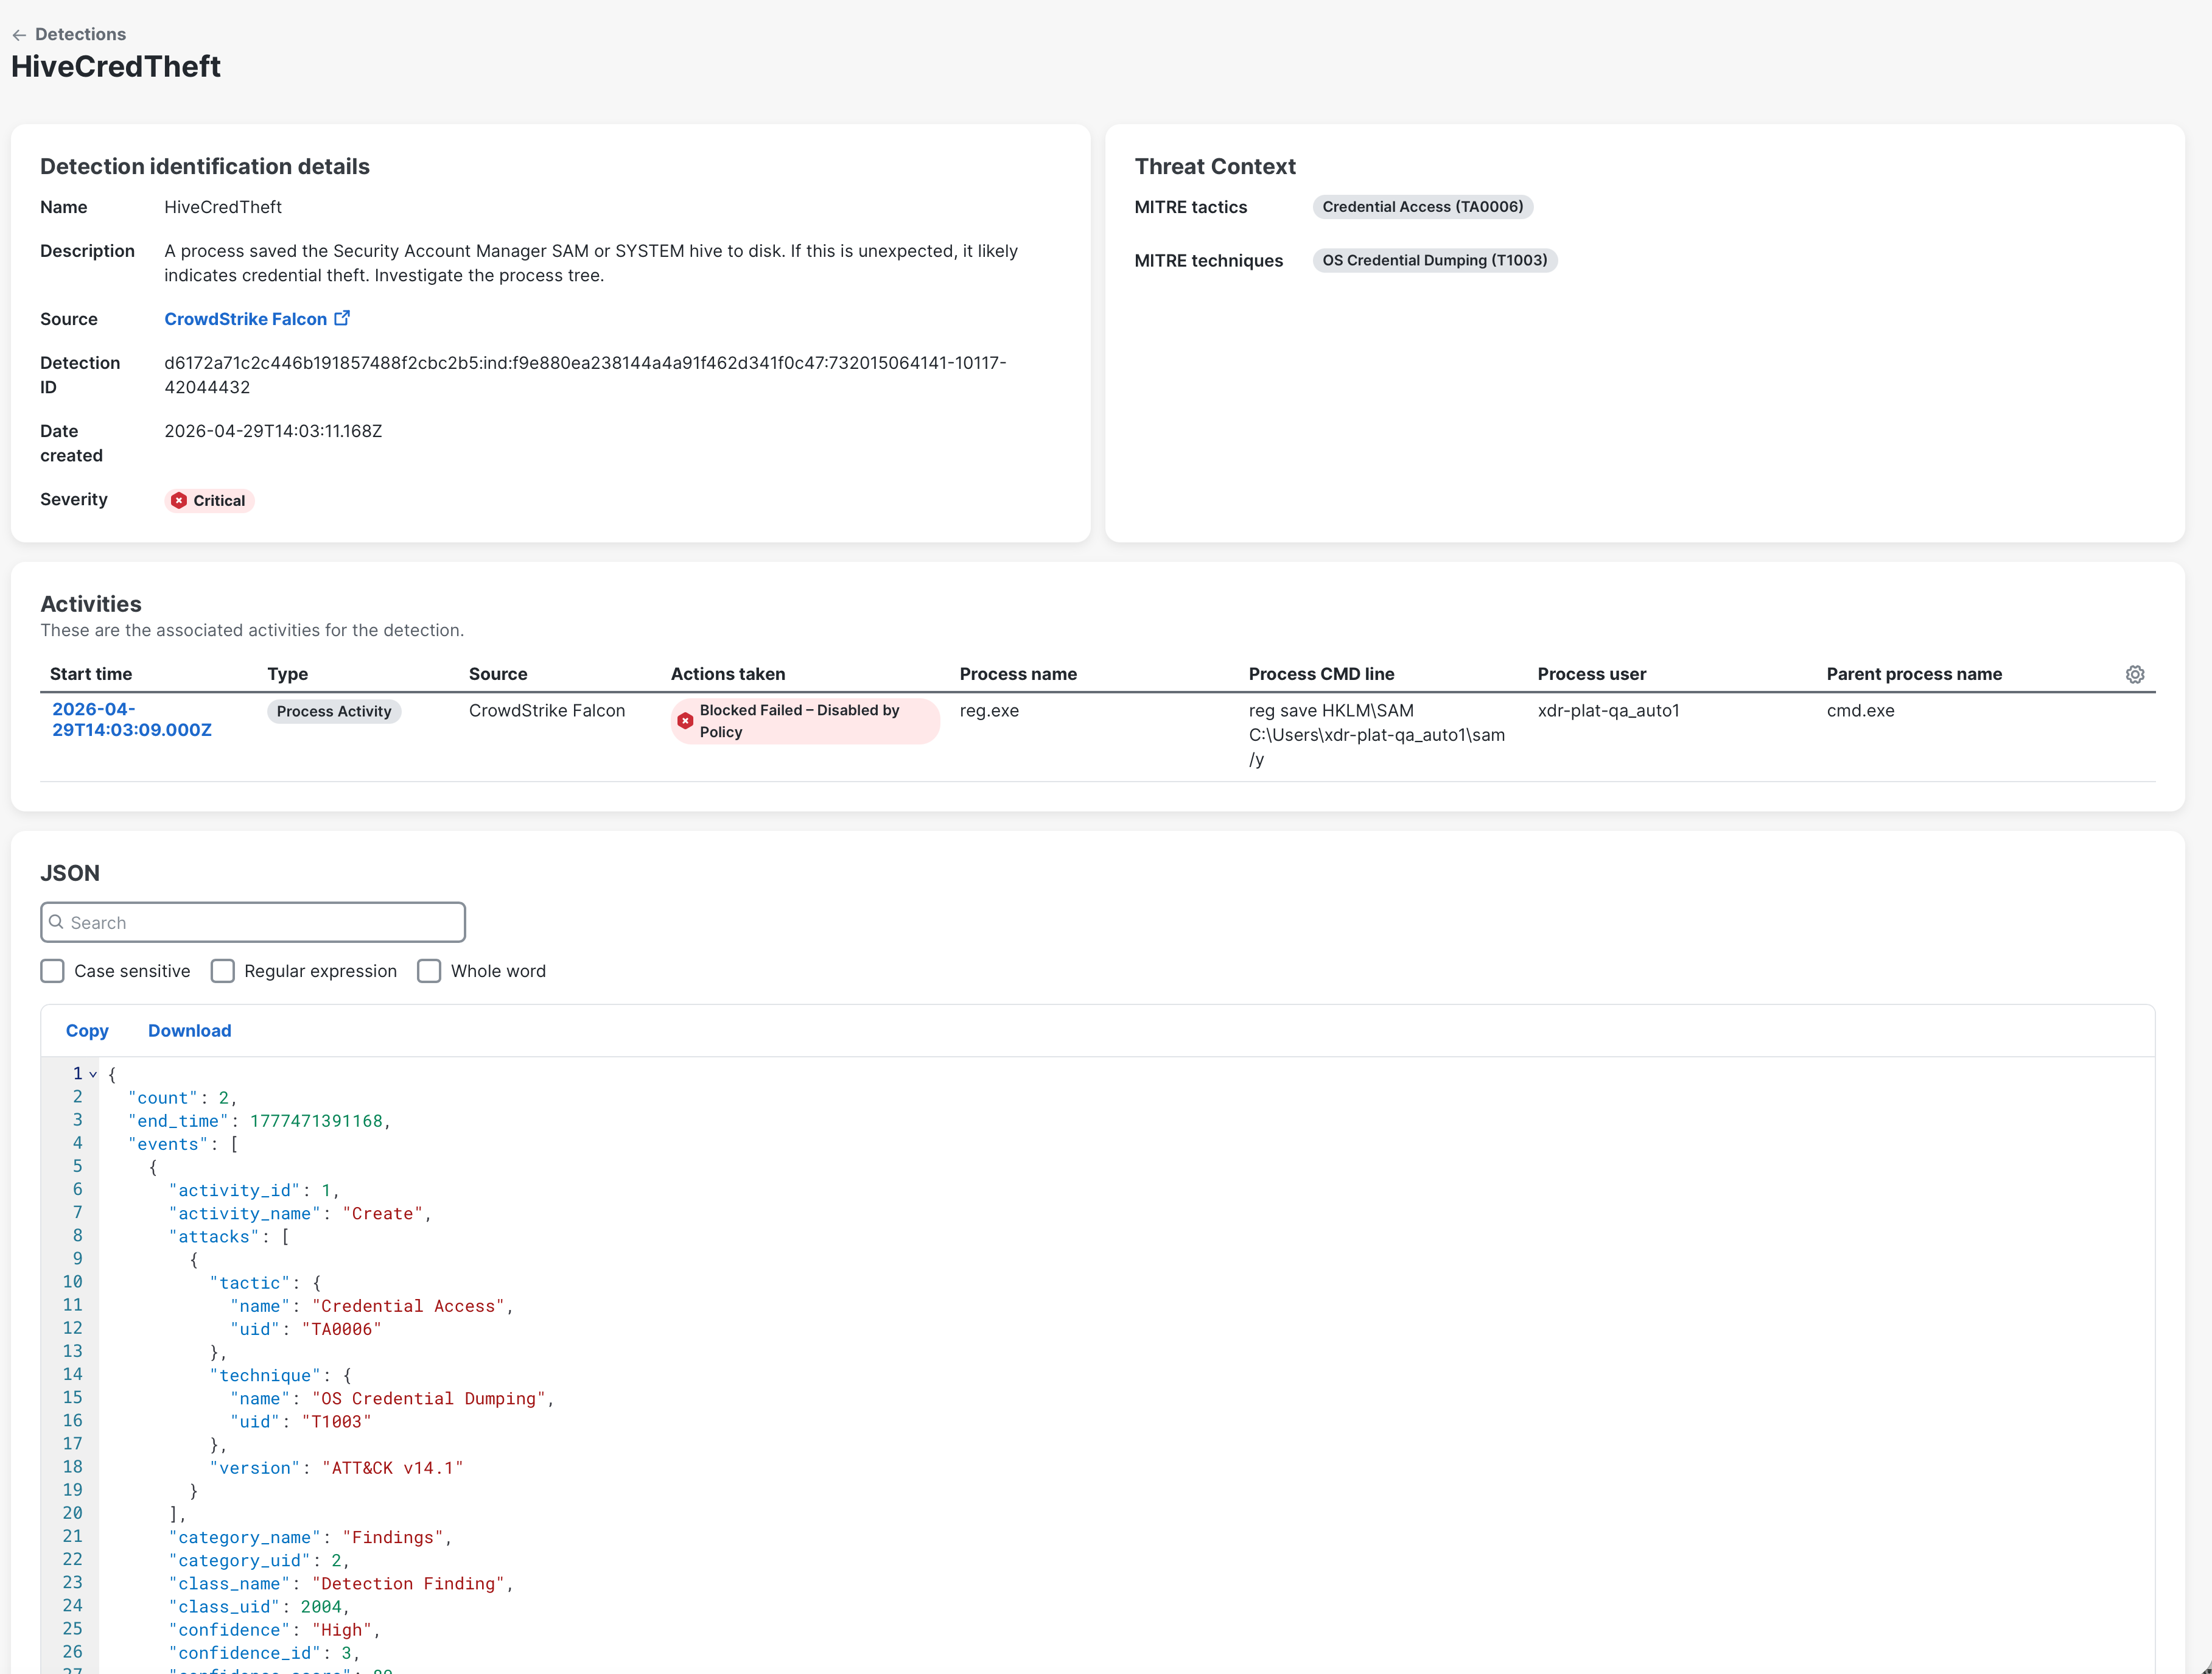
Detection Identification Details
The Detection identification details area displays more information about the detection. For more information, see Detection Details. The Severity is the threat level of the detection and the Threat Context area displays the MITRE ATT&CK tactics and techniques used by the detection.
The Incident action determines how the detection contributes to incident creation under the applied incident tuning rule and the Applied rule displays the incident tuning rule that sets the incident action. Click the rule link to open the rule on the Incident Tuning page in a new tab.
Note: For custom rules, the displayed rule name may differ from the current name on the Incident Tuning page. It reflects the rule name at the time the rule was applied and may not reflect changes made later.
Click the Incident tuning drop-down list in the upper right corner of the detection details page to create an include or exclude rule on the Incident Tuning page in a new tab. The rule drawer is prefilled with details from the detection. Make any necessary changes before creating the rule. For details, see Incident Tuning.
Device Details
The Device details area displays available information about the device associated with the current detection at the time the detection was received. If the device reported in the detection matches a device in Assets, the XDR Assets area displays the matched device information, enriched with asset information after ingestion. Click the View in Devices link to display the device information on the Device Details page in a new tab. For details, see Device Details. Click View more to open the Device details drawer for more information on the matched device information, including the date and time the device information was last updated at enrichment time in Assets (Last updated in inventory) and the date and time the device information was enriched with asset information and added to the detection (Enriched at).
The Source reported area displays the device information from the source product as part of the current detection. As a result, the information in the XDR Assets area may differ from the information displayed in the Source reported area. Click View more to open the Device details drawer for more information on the device, including the hardware, primary network identity, and network interface information.
Note: The Device Details area displays device information for the endpoint most closely associated with the behavior that triggered the current detection. Incidents may include additional devices identified from other detections or telemetry.
Activities
The Activities area displays associated activities as supporting evidence for the detection. Click an activity link to open the activity drawer with more information on the activity, including endpoint, traffic and connection, and device details. The columns displayed in the activities table depend on the activity type. For information on the data displayed for the Network Activity type, see Activities. To reorder the table columns, click and drag a column header to the desired position in the table. Click the (Settings) to open the Table Settings drawer and check the check boxes next to the columns you want displayed in the activity logs table. If custom columns are displayed, click Reset to defaults to reset the table column settings to its default values.
JSON
The JSON area displays the detection and related activities in JSON format. You can search for keywords in the Search field, with Case Sensitive, Regular Expression, and Whole Word options available to refine the search. Click Download or Copy to download or copy the detection and related activities displayed in JSON format.