Secure Network Analytics Integration
Cisco Secure Network Analytics (formerly known as Stealthwatch Enterprise) provides full visibility across your network and uses advanced analytics to detect and respond to threats in real time. These threats include command-and-control (C&C) attacks, ransomware, distributed denial-of-service (DDoS) attacks, illicit cryptomining, unknown malware, and insider threats.
Secure Network Analytics uses agentless behavioral monitoring and anomaly detection to identify suspicious activities, helping detect and respond to threats without needing software agents installed on devices.
By integrating with other global threat intelligence sources and internal visibility tools, Secure Network Analytics validates its findings using confirmed threat information and local data. Additionally, integration with Cisco control devices enables quick, two-click mitigation and resolution of detected threats.
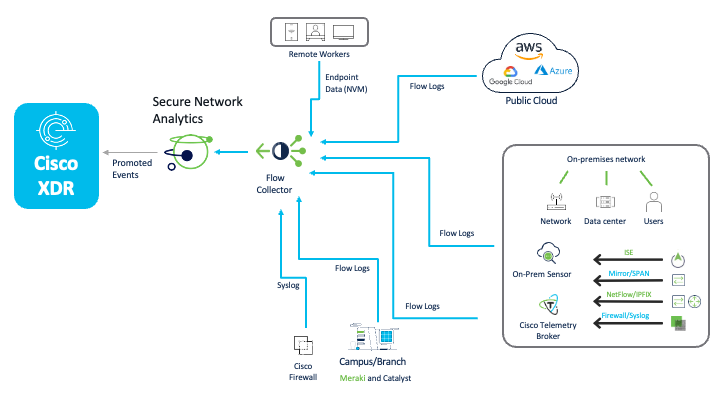
The telemetry sources for Secure Network Analytics integrated with Cisco XDR are shown below:
Once Secure Network Analytics is integrated with Cisco XDR, Critical and Major security alarms are sent from the Security Services Exchange and analyzed by the current platform to support investigations. These alarms are converted into incidents, complete with details like sightings, observables, and indicators based on the alarm metadata.
During an investigation, for every valid IP address requested, Secure Network Analytics provides:
-
A list of associated security events from the last 30 days,
-
The most recent 100 security events, and
-
Events where the IP was involved as either the source or destination.
More information on configuring your Secure Network Analytics Manager to send security alarms to Security Services Exchange and providing access to the alarms is available on the Secure Network Analytics Configuration Guides page.
-
In the Cisco XDR navigation menu, choose Administration > Integrations.
-
On the Integrations page, click the Cisco tab and navigate to the Secure Network Analytics integration.
-
Click Get Started. The Secure Network Analytics integration page is displayed.
-
Expand the Integration Guide area and follow the instructions on how to add the Secure Network Analytics integration in Cisco XDR.
You can configure the following alarm data in Secure Network Analytics to be promoted to Cisco XDR to be used in Endpoint Detection and Response correlated incidents:
-
Bot Infected Host - Successful C&C Activity
-
Suspect Data Hording
-
Suspect Data Loss
Depending on your Secure Network Analytics version, you must configure Secure Network Analytics to send these alarms to Cisco XDR:
-
v7.4.2 and v7.5.0: Follow the instructions in the Alarm Configuration for Cisco XDR Guide 7.4.2 or Alarm Configuration for Cisco XDR Guide 7.5.0.
-
v7.5.1: Follow the instructions in the Secure Network Analytics and Cisco XDR Integration Guide 7.5.1.
-
v7.5.2: Follow the instructions in the Secure Network Analytics and Cisco XDR Integration Guide 7.5.2.
Incidents are groups of correlated events generated using data ingested from your integrated products. By correlating events which could be part of a larger threat into an incident, it reduces the time typically required to investigate individual security alerts or detections. For more information about Cisco XDR Incidents feature, see Incidents.
When you enable the Secure Network Analytics integration, Cisco XDR ingests the configured Analytics alarm data to create incidents. For more information, see the Analytics: Detections, Alerts, and Observations guide.
To view incidents with Secure Network Analytics data:
-
In the Cisco XDR navigation menu, choose Incidents.
-
Look for Cisco Secure Network Analytics in the Source column to find incidents generated with Secure Network Analytics data.
-
Select an incident and open the Incident Detail page.
-
Click on the Detection page to see events from Secure Network Analytics and other sources.
Note: The link from an event to the alarm in Secure Network Analytics is unavailable.
To verify that Cisco XDR is receiving Secure Network Analytics data when no incidents are present, go to the Incidents > Detections page and filter the table by Secure Network Analytics using the Source drop-down list. For more information, see the Detections help topic.
You can perform the following tasks after you integrate Secure Network Analytics with Cisco XDR:
-
Investigations - Start a new investigation by searching on suspicious indicators of compromise to extract observables for enrichment. To verify that this integration is working, and to see what kind of data is returned, investigate one or more observables about which you know Secure Network Analytics has recent information. For details, see Investigate.
-
Detections - View the security events generated by Secure Network Analytics to validate the data that is ingested by Cisco XDR for incident generation. For details, see Detections.
-
Dashboard - Add Secure Network Analytics cards to a dashboard in Control Center to view data, such as Top Alarming Hosts. For details, see Configure Dashboards and Cards. For a list of available Secure Network Analytics cards, see Integration Cards.
-
Pivot Menu - Use the Pivot menu to access actions in Secure Network Analytics. Available actions include viewing an IP address Host Report in Secure Network Analytics.
-
Atomic Actions - The atomic actions for Secure Network Analytics can be used as building blocks in custom workflows. These can be found as available Actions in the left menu of the Workflow Editor. See Atomic Actions and Workflows.