Activities
The Activities page displays activity data from your environment using the Industry Standard Open Cybersecurity Schema Framework (OCSF), version 1.4. For details, see Open Cybersecurity Schema Framework. The normalized data are analyzed by Cisco XDR to generate Cisco XDR detections; these detections are then analyzed by the detection engine and may be correlated into incidents. For more information on detections, see Detections.
Note: The activity data is from Cisco XDR native sources only and it does not include integrated third-party products.
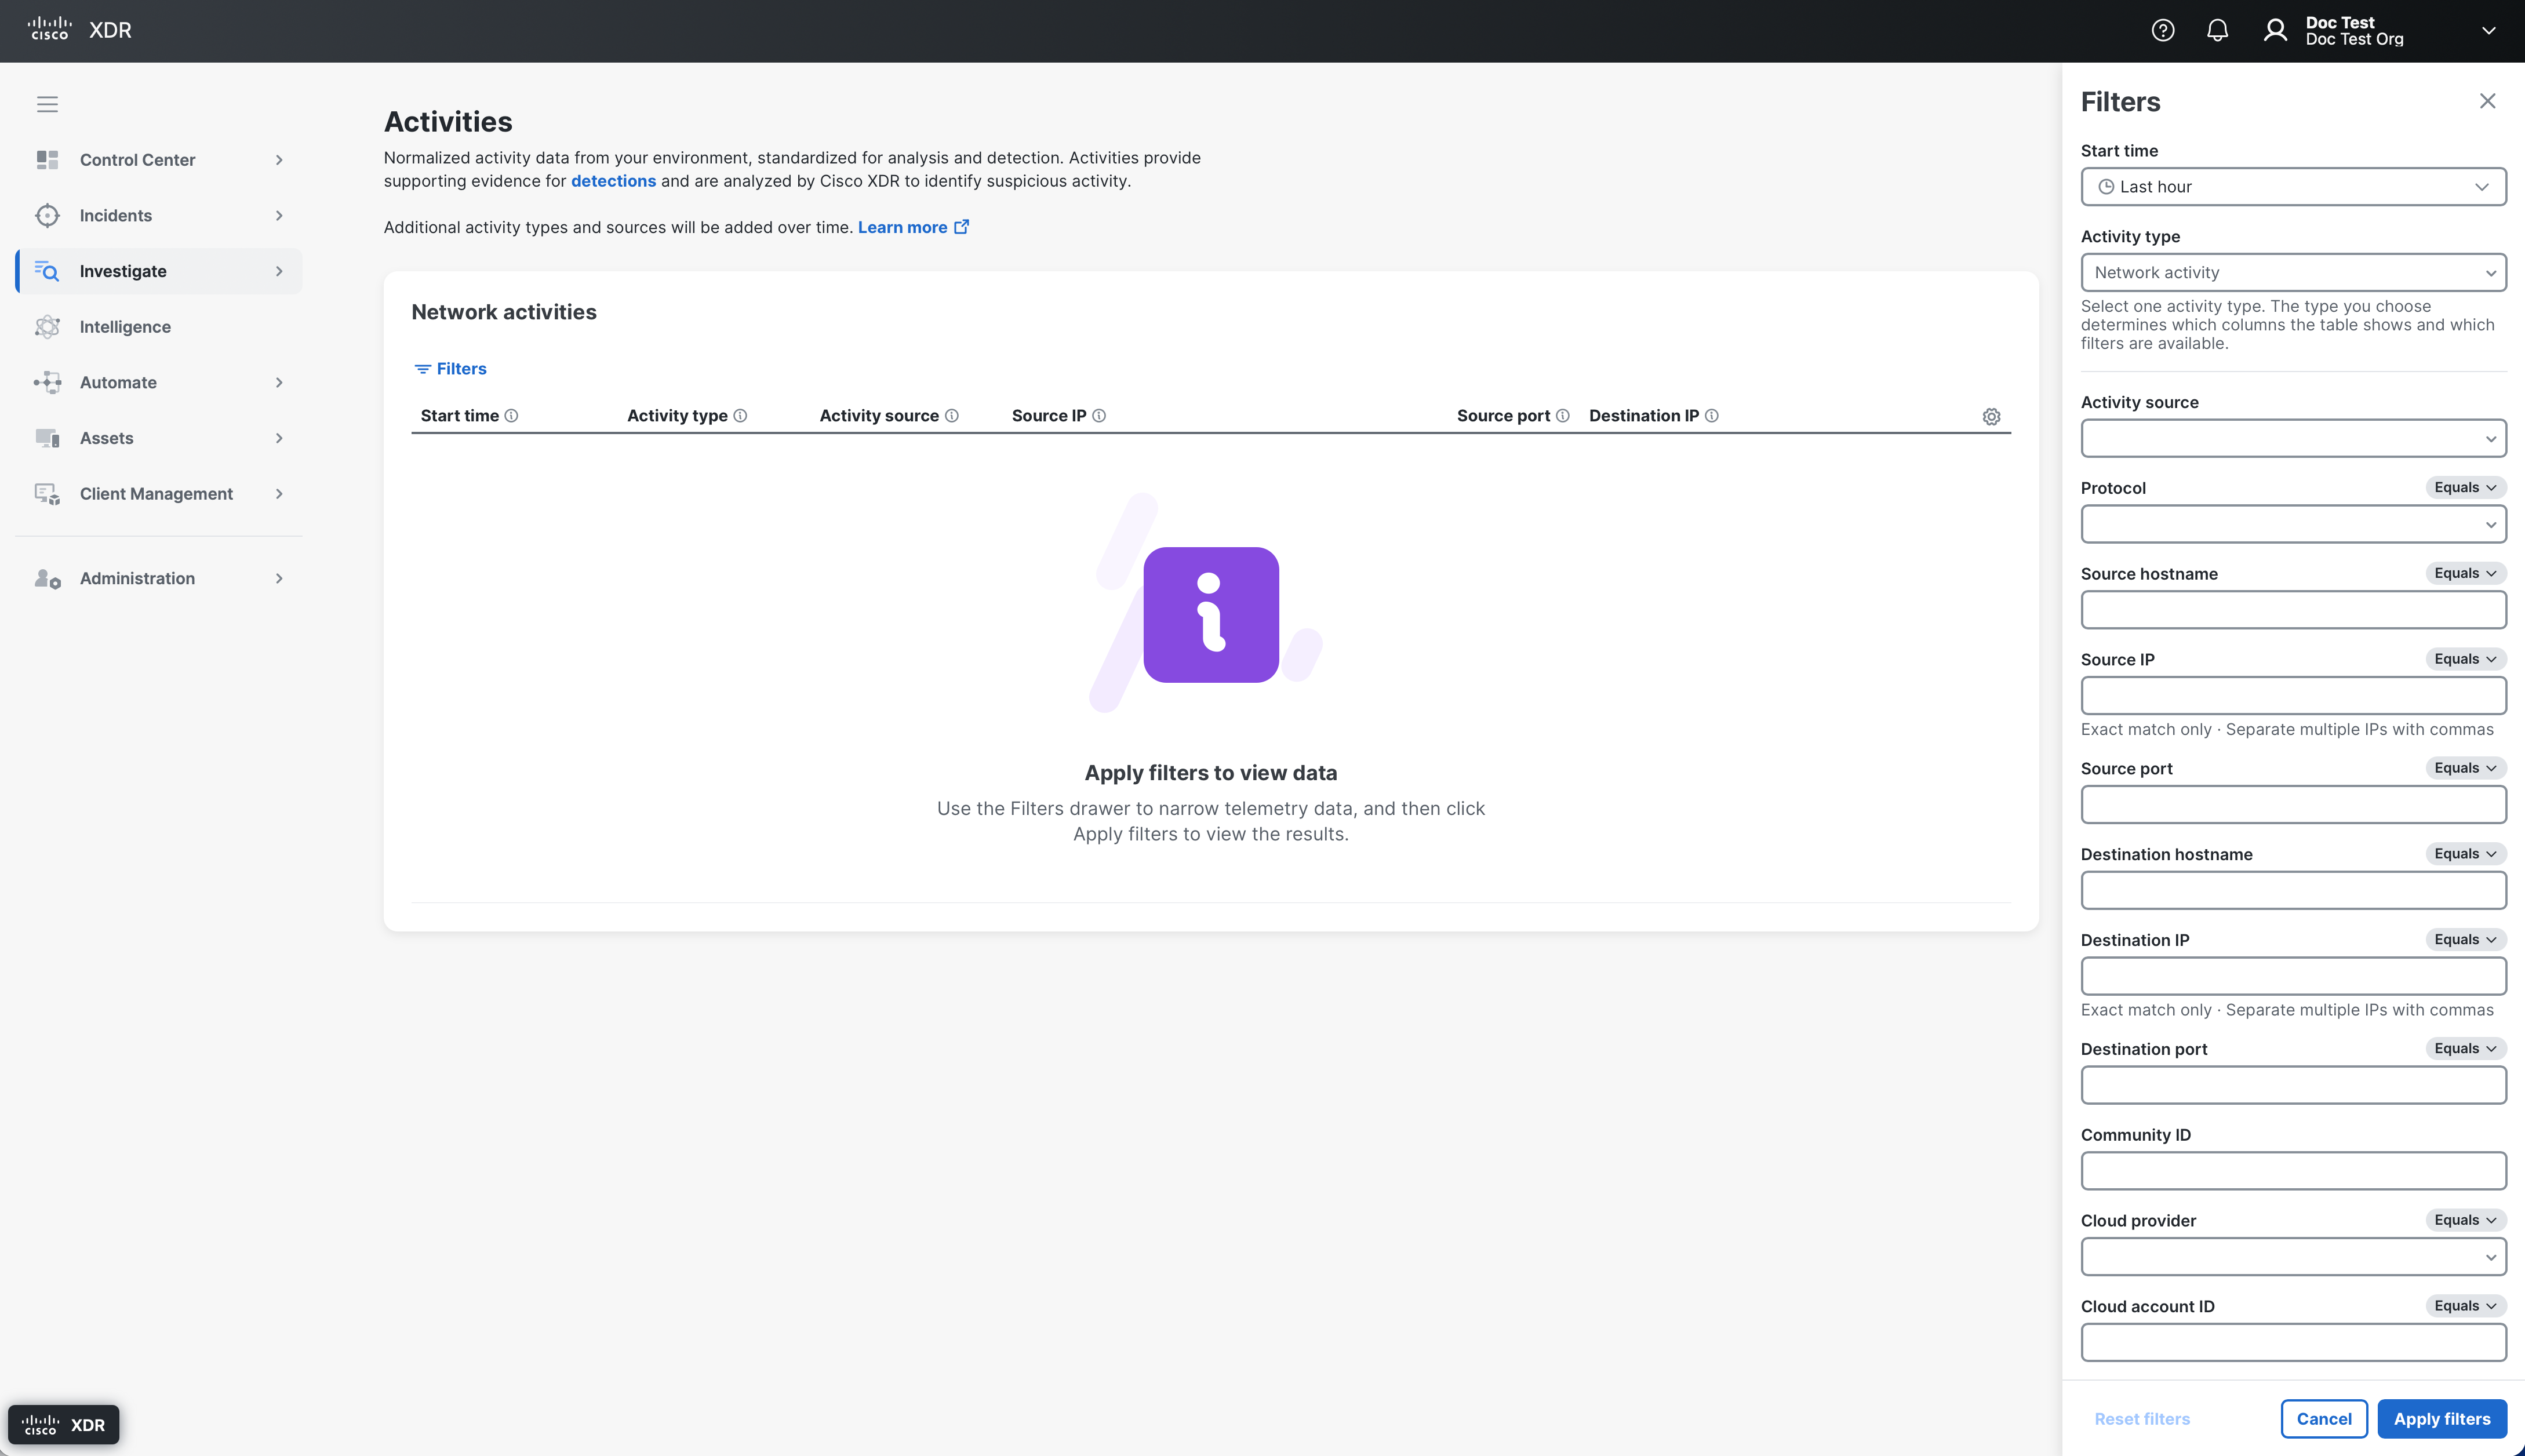
Choose Investigate > Activities in the navigation menu and choose the Activity type and apply filters in the Filters drawer to view activities from your endpoints. You can only select one activity type at a time. The selected type determines the columns displayed in the table and the available filters. For more information, see Filter Activities.
The activities table supports the following activity types:
Note: Data is not displayed on the Activities page until you apply filters in the Filters drawer.
 Network Activities
Network activities record connections between systems, including related IP addresses, ports, and protocols. The network activities table currently supports network activities from the following activity sources:
-
Cisco ONA - The network activities from Cisco ONA sensor are displayed if ONA is installed in your on-premises environment. The network traffic from Cisco ONA will remain available in the Event Viewer in Secure Cloud Analytics until the migration is complete on October 24th, 2026.
-
Cisco Telemetry Broker - The network activities from Cisco Telemetry Broker are displayed if the Cisco Telemetry Broker sensor is installed in your on-premises environment. The network traffic from Cisco Telemetry Broker will remain available in the Event Viewer in Secure Cloud Analytics until the migration is complete on October 24th, 2026.
-
Cisco Meraki - The network activities from Meraki are displayed if the Cisco Meraki integration is configured on the Integrations page. For details, see Cisco Meraki Integration.
-
Oracle VCN Flow Logs - The network activities from Oracle VCN flow logs are displayed if the Oracle Cloud Infrastructure integration is configured on the Integrations page. For details, see Oracle Cloud Infrastructure Integration.
-
AWS VPC Flow Logs - The network activities from AWS VPC flow logs are displayed if if the Amazon Web Services integration is configured on the Integrations page. For details, see Amazon Web Services Integration. The network traffic from AWS VPC Flow Logs will remain available in the Event Viewer in Secure Cloud Analytics until the migration is complete on October 24th, 2026.
-
Microsoft Azure Flow Logs - The network activities from Microsoft Azure flow logs are displayed if the Microsoft Azure integration is configured in Secure Cloud Analytics. For details, see Microsoft Azure Integration Quick Start Guide. The network traffic from Microsoft Azure Flow Logs will remain available in the Event Viewer in Secure Cloud Analytics until the migration is complete on October 24th, 2026.
-
Google VPC Flow Logs - The network activities from Google VPC Flow Logs are displayed if the Google Cloud Platform integration is configured on the Integrations page. For details, see Google Cloud Platform Integration. The network traffic from Google VPC Flow Logs will remain available in the Event Viewer in Secure Cloud Analytics until the migration is complete on October 24th, 2026.
-
Cisco NVM - The network activities from Cisco Secure Client Network Visibility Module (NVM) are displayed if the XDR Default Deployment is installed on your endpoints. For more information on NVM, see Network Visibility Module in Cisco XDR and for details on the XDR Default Deployment, see Deployments.
Note: The Network Visibility Module captures network conversations as bidirectional flows and the network activities table displays unidirectional flows only. As a result, the table may show the same conversation in two rows, one for each direction.
Network Activities Table Column Descriptions
|
Column Name |
Description |
|---|---|
|
Start time |
Date and time the activity was first recorded. This may differ from when the flow originally began. |
|
Activity type |
Type of activity assigned during data normalization (Network Activity). |
|
Activity source |
Name of the source product that recorded the activity. For example, Cisco NVM. |
|
Source IP |
The IP address of the host sending the communication, relative to your location (Internal or External). For external IP addresses only, the country flag is displayed next to the IP address and it reflects the geographical location of the endpoint. Click the |
|
Source port |
Port number used by the source system to initiate the communication. |
|
Destination IP |
The IP address of the host receiving the communication, relative to your location (Internal or External). For external IP addresses only, the country flag is displayed next to the IP address and it reflects the geographical location of the endpoint. Click the |
|
Destination port |
Port number of the destination system. |
|
Protocol |
Identifier of the protocol used in the flow communication. |
|
Bytes out |
Total amount of data sent from the source to the destination during this activity, in bytes. If the activity is a segment of a longer conversation, the aggregate values are displayed as Cumulative bytes out in the activity details drawer. Note: The Network Visibility Module receives network activities as bidirectional flows and displays it in the network activities as separate unidirectional rows. As a result, traffic is always displayed as outbound and there is no Bytes in value. The data sent from destination to the source is displayed as outbound data in the Bytes out column. |
|
Community ID |
A standardized flow identifier for a network flow that is generated from details, such as IP addresses and ports, to ensure that the same network conversation is recognized consistently across supported network sources. For more information, see Community ID Flow Hashing. Note: This is an optional column that is only available in the Table Settings drawer. For details, see Customize Columns. |
|
Actor process |
The process that initiated the activity. Details may include name, process ID, executable path, and command line. Note: This is an optional column that is only available in the Table Settings drawer. For details, see Customize Columns. |
|
Actor parent process |
The immediate parent of the actor process. It is the process that launched the actor process and provides context about its place in the process hierarchy. Note: This is an optional column that is only available in the Table Settings drawer. For details, see Customize Columns. |
 (Pivot Menu) icon next to the IP address to take action on it. You can perform some actions directly in the API Activities
API activities record administrative actions performed in your cloud environment, such as creating a virtual machine, reading a secret, or changing a permission. The API activities table currently supports API activities from the following activity sources:
Note: If your organization restricts outbound traffic based on destination IP addresses, add the Cisco XDR IP addresses for your deployment region to your allowlist. For a list of the IP addresses, see IP Addresses for Integrations.
-
AWS CloudTrail Logs - The API activities from AWS CloudTrail logs are displayed if the Amazon Web Services integration is configured on the Integrations page. For details, see Amazon Web Services Integration. The cloud traffic from Amazon Web Services will remain available in the Event Viewer in Secure Cloud Analytics until the migration is complete on October 24th, 2026.
-
Google Cloud Audit Logs - The API activities from Google Cloud audit logs are displayed if the Google Cloud Platform integration is configured on the Integrations page. For details, see Google Cloud Platform Integration. The cloud traffic from Google Cloud Platform will remain available in the Event Viewer in Secure Cloud Analytics until the migration is complete on October 24th, 2026.
-
Microsoft Azure Activity Logs - The API activities from Microsoft Azure activity logs are displayed if the Microsoft Azure integration is configured in Secure Cloud Analytics. For details, see Microsoft Azure Integration Quick Start Guide. The cloud traffic from Microsoft Azure will remain available in the Event Viewer in Secure Cloud Analytics until the migration is complete on October 24th, 2026.
-
Microsoft Entra Audit Logs - The API activities from Microsoft Entra audit logs are displayed if the Microsoft Azure integration is configured in Secure Cloud Analytics. For details, see Microsoft Azure Integration Quick Start Guide. The cloud traffic from Microsoft Azure will remain available in the Event Viewer in Secure Cloud Analytics until the migration is complete on October 24th, 2026.
API Activities Table Column Descriptions
|
Column Name |
Description |
|---|---|
|
Start time |
Date and time the activity was first recorded. |
|
Activity type |
Type of activity assigned during data normalization (API Activity). |
|
Activity name |
Name of the action performed (Create, Read, Update, or Delete). If none of the categories apply, the provider-specific operation name is displayed, such as SendCommand. |
|
Activity source |
Name of the source product that recorded the activity. For example, Microsoft Azure Activity Logs. |
| Status | Indicates the outcome of the activity (Success, Failure, or Unknown). |
| Operation |
Action that was performed or requested by the source product. For example, PutTargets for AWS, v1.compute.subnetworks.get for Google Cloud Platform, Microsoft.Storage/storageAccounts/LIstServiceSas/action for Microsoft Azure, or Remove service principal for Microsoft Entra. |
| API Service |
Name of the service that received or handled the operation. For example, ssm.amazonaws.com, compute.googleapis.com, Microsoft.Storage, or Core Directory. |
|
Resource |
Name of the resource on which the operation was performed. |
| Source IP |
The IP address from which the activity originated. If a cloud service initiated the activity on your behalf, the column is empty and the cloud service is displayed in the optional Source service name column. Click the |
|
Actor user |
The user who initiated the activity. Depending on the activity source, this can be an email address, username, name of an assumed role, or service. |
|
Actor user ID |
The ID of the user who initiated the activity. For Microsoft Azure Activity Logs, the ID may be displayed without a corresponding user name. |
|
Actor app name |
Application that initiated the activity. For Microsoft Entra Audit Logs, this may be the only identity displayed. |
Account Change Activities
Account change activities record changes to user accounts in your cloud directory, such as creating or deleting users, granting or revoking console access, resetting passwords, and enabling or disabling multi-factor authentication. The account change activities table currently supports account change activities from the following activity sources:
-
AWS CloudTrail Logs - The account change activities from AWS CloudTrail logs are displayed if the Amazon Web Services integration is configured on the Integrations page. For details, see Amazon Web Services Integration. The cloud traffic from Amazon Web Services will remain available in the Event Viewer in Secure Cloud Analytics until the migration is complete on October 24th, 2026.
-
Microsoft Entra Audit Logs - The account change activities from Microsoft Entra audit logs are displayed if the Microsoft Azure integration is configured in Secure Cloud Analytics. For details, see Microsoft Azure Integration Quick Start Guide. The cloud traffic from Microsoft Azure will remain available in the Event Viewer in Secure Cloud Analytics until the migration is complete on October 24th, 2026.
Account Change Activities Table Column Descriptions
|
Column Name |
Description |
|---|---|
|
Start time |
Date and time the activity was first recorded. |
|
Activity type |
Type of activity assigned during data normalization (Account Change). |
|
Activity name |
Name of the action performed (Create, Delete, Enable, or Password Reset). The Password Reset activity name indicates that the administrator reset another user's password. If none of the categories apply, the provider-specific operation name is displayed. |
|
Activity source |
Name of the source product that recorded the activity (AWS CloudTrail Logs or Microsoft Entra Audit Logs). |
| Status | Indicates the outcome of the activity (Success, Failure, or Unknown). |
| Operation |
Name of the operation as defined by the source product. For example, AWS uses CreateUser and DeleteUser, and Microsoft Entra uses Add user and Reset user password. |
|
API service |
Cloud provider service that handled the account change. For example, iam.amazonaws.com for AWS, and Core Directory or Authentication Methods for Microsoft Entra. |
| User | Indicates the user account that was changed. The Actor user column identifies the user who made the change. |
| Source IP |
The IP address from which the change request orginated. If a cloud service initiated the activity on your behalf, the column is empty and the cloud service is displayed in the optional Source service name column. Click the |
| Actor user |
The user who initiated the change. For some automated changes, Microsoft Entra does not identify a user. |
|
Actor app name |
Application or client that initiated the activity. For Microsoft Entra Audit Logs, this may be the only identity displayed. For AWS CloudTrail Logs, it identifies the took that sent the request. |
Authentication Activities
Authentication activities record successful and failed sign-in attempts to your cloud provider, including the user, target account or role, source, and outcome of each attempt. The authentication activities table currently supports authentication activities from the following activity sources:
-
AWS CloudTrail Logs - The authentication activities from AWS CloudTrail logs are displayed if the Amazon Web Services integration is configured on the Integrations page. For details, see Amazon Web Services Integration. The cloud traffic from Amazon Web Services will remain available in the Event Viewer in Secure Cloud Analytics until the migration is complete on October 24th, 2026.
Authentication Activities Table Column Descriptions
|
Column Name |
Description |
|---|---|
|
Start time |
Date and time the activity was first recorded. |
|
Activity type |
Type of activity assigned during data normalization (Authentication). |
|
Activity name |
Name of the action performed:
|
|
Activity source |
Name of the source product that recorded the activity (AWS CloudTrail Logs). |
| Status | Indicates the outcome of the activity (Success, Failure, or Unknown). |
|
Operation |
Name of the sign-in operation recorded by the cloud provider. For example, ConsoleLogin for a sign-in to the AWS Management Console, and AssumeRole when a user or service assumes a role. |
| User | Indicates the identity associated with the sign-in. For a role-based sign-in, this is the role session rather than an individual. For example, in AROAZCLZIPM3MZ6BYHKJJ:merqui, the value after the colon is the session name. |
|
Service |
Cloud provider service that handled the sign-in. For example, signin.amazonaws.com. |
| Source IP |
The IP address from which the sign-in was requested. Click the |
|
Actor user |
The user who initiated the sign-in request. The value typically matches the User column. When a user assumes another identity, such as a role, the Actor user column identifies the requester and the User column identifies the assumed identity. |
Group Management Activities
Group management activities record changes to groups in your cloud directory, such as creating and deleting groups, adding and removing members, and granting and revoking group permissions. The group management activities table currently supports group management activities from the following activity sources:
-
AWS CloudTrail Logs - The group management activities from AWS CloudTrail logs are displayed if the Amazon Web Services integration is configured on the Integrations page. For details, see Amazon Web Services Integration. The cloud traffic from Amazon Web Services will remain available in the Event Viewer in Secure Cloud Analytics until the migration is complete on October 24th, 2026.
-
Microsoft Entra Audit Logs - The group management activities from Microsoft Entra audit logs are displayed if the Microsoft Azure integration is configured in Secure Cloud Analytics. For details, see Microsoft Azure Integration Quick Start Guide. The cloud traffic from Microsoft Azure will remain available in the Event Viewer in Secure Cloud Analytics until the migration is complete on October 24th, 2026.
Group Management Activities Table Column Descriptions
|
Column Name |
Description |
|---|---|
|
Start time |
Date and time the activity was first recorded. |
|
Activity type |
Type of activity assigned during data normalization (Group Management). |
|
Activity name |
Name of the action performed:
|
|
Activity source |
Name of the source product that recorded the activity (AWS CloudTrail Logs or Microsoft Entra Audit Logs). |
| Status | Indicates the outcome of the activity (Success, Failure, or Unknown). |
|
Group |
Name of the group that changed. This column is empty when the cloud provider does not provide a group name. |
| Group ID | The unique identifier assigned to the group by the cloud provider. For Microsoft Entra Audit Logs, this is the directory object ID. This value can identify the group when the Group column is empty. |
| User | Indicates the member added or removed from the group. It does not apply to changes to the group itself. |
|
Source IP |
The IP address from which the change request originated. Click the |
|
Actor user |
The user who made the change. |
|
Actor app name |
Application or client that initiated the activity. For Microsoft Entra Audit Logs, this may be the only identity displayed. For AWS CloudTrail Logs, it identifies the took that sent the request. |
|
Operation |
Name of the operation as defined by the cloud provider. For example, AWS uses AddUserToGroup and RemoveUserFromGroup, and Microsoft Entra uses Add member to group and Remove member from group. |
Filter Activities
You can filter the display of activities based on start time, source, transport protocol, source hostname, source IP address, source port, destination hostname, destination IP address, destination port, community ID, cloud account ID, cloud region, actor process, or actor parent process, depending on the activity type selected.
The Activities page will only display data after you apply filters in the Filters drawer. The Filters drawer automatically opens when you open the Activities page. You can also click the  (Filters) icon above the list of network activities to open the Filters drawer. Click Apply filters to save your filter options. The activities list will display activities that match the filter criteria and the Applied Filters area is displayed across the top of the activities list. Click the
  (Expand) icon to display all the filter selections with the filter category and the filter tags. To remove a selected filter category, click the
  (Delete) icon or click the X in the filter tag to remove a specific selection within the filter category and the list will refresh.
Note: The query will timeout after 10 minutes. To return results more quickly, narrow the time range or apply additional filters.
You can narrow the display of activities based on a specific timeframe in the Start time drop-down list. A banner at the top of the Activities page displays the query timestamp, indicating that the results reflect the data available when the query ran. Activities ingested after that time are not included. The selected time filter is anchored to that query time as you paginate through the results. Search results expire one hour after the timestamp. When results expire, click Refresh in the expiration message to rerun the search with the current filters. The refreshed results may include newly ingested activities. If you navigate away from the Activities page, you must reapply the filters.
-
Last hour - Displays the activities observed within the last 1 hour that match the filter criteria.
-
Last 24 hours - Displays the activities observed within the last 24 hours that match the filter criteria.
-
Last 7 days - Displays the activities that started within the last 7 days that match the filter criteria.
-
Custom range - Uses the Start time to search for activities between the selected start and end date and time that match the filter criteria.
In the Source IP and Destination IP fields, you must enter the full and exact IP address (IPv4 or IPv6). To filter for multiple IPs, separate each address with a comma.
If applicable, you can choose a filter operator in the top right corner of a field to refine your search.
-
Equals - Displays results that exactly match any of the specified values.
-
Does NOT equal - Displays results that do not exactly match any of the specified values.
-
Contains - Displays results that contain any of the specified values. For example, entering acme matches server.acme.test.
Reorder and Customize Columns
You can reorder the columns in the table and select the columns displayed to customize the table for the data you want to view.
Reorder Columns
To reorder the table columns, click and drag a column header to the desired position in the table.
Customize Columns
Click the  (Settings) icon to open the Table Settings drawer and check the check boxes next to the columns you want displayed in the network activities table and click Apply. The
  (Lock) icon indicates that the column is mandatory and it is always displayed in the network activities table. You can reorder the columns by clicking the
View Activity Details in Drawer
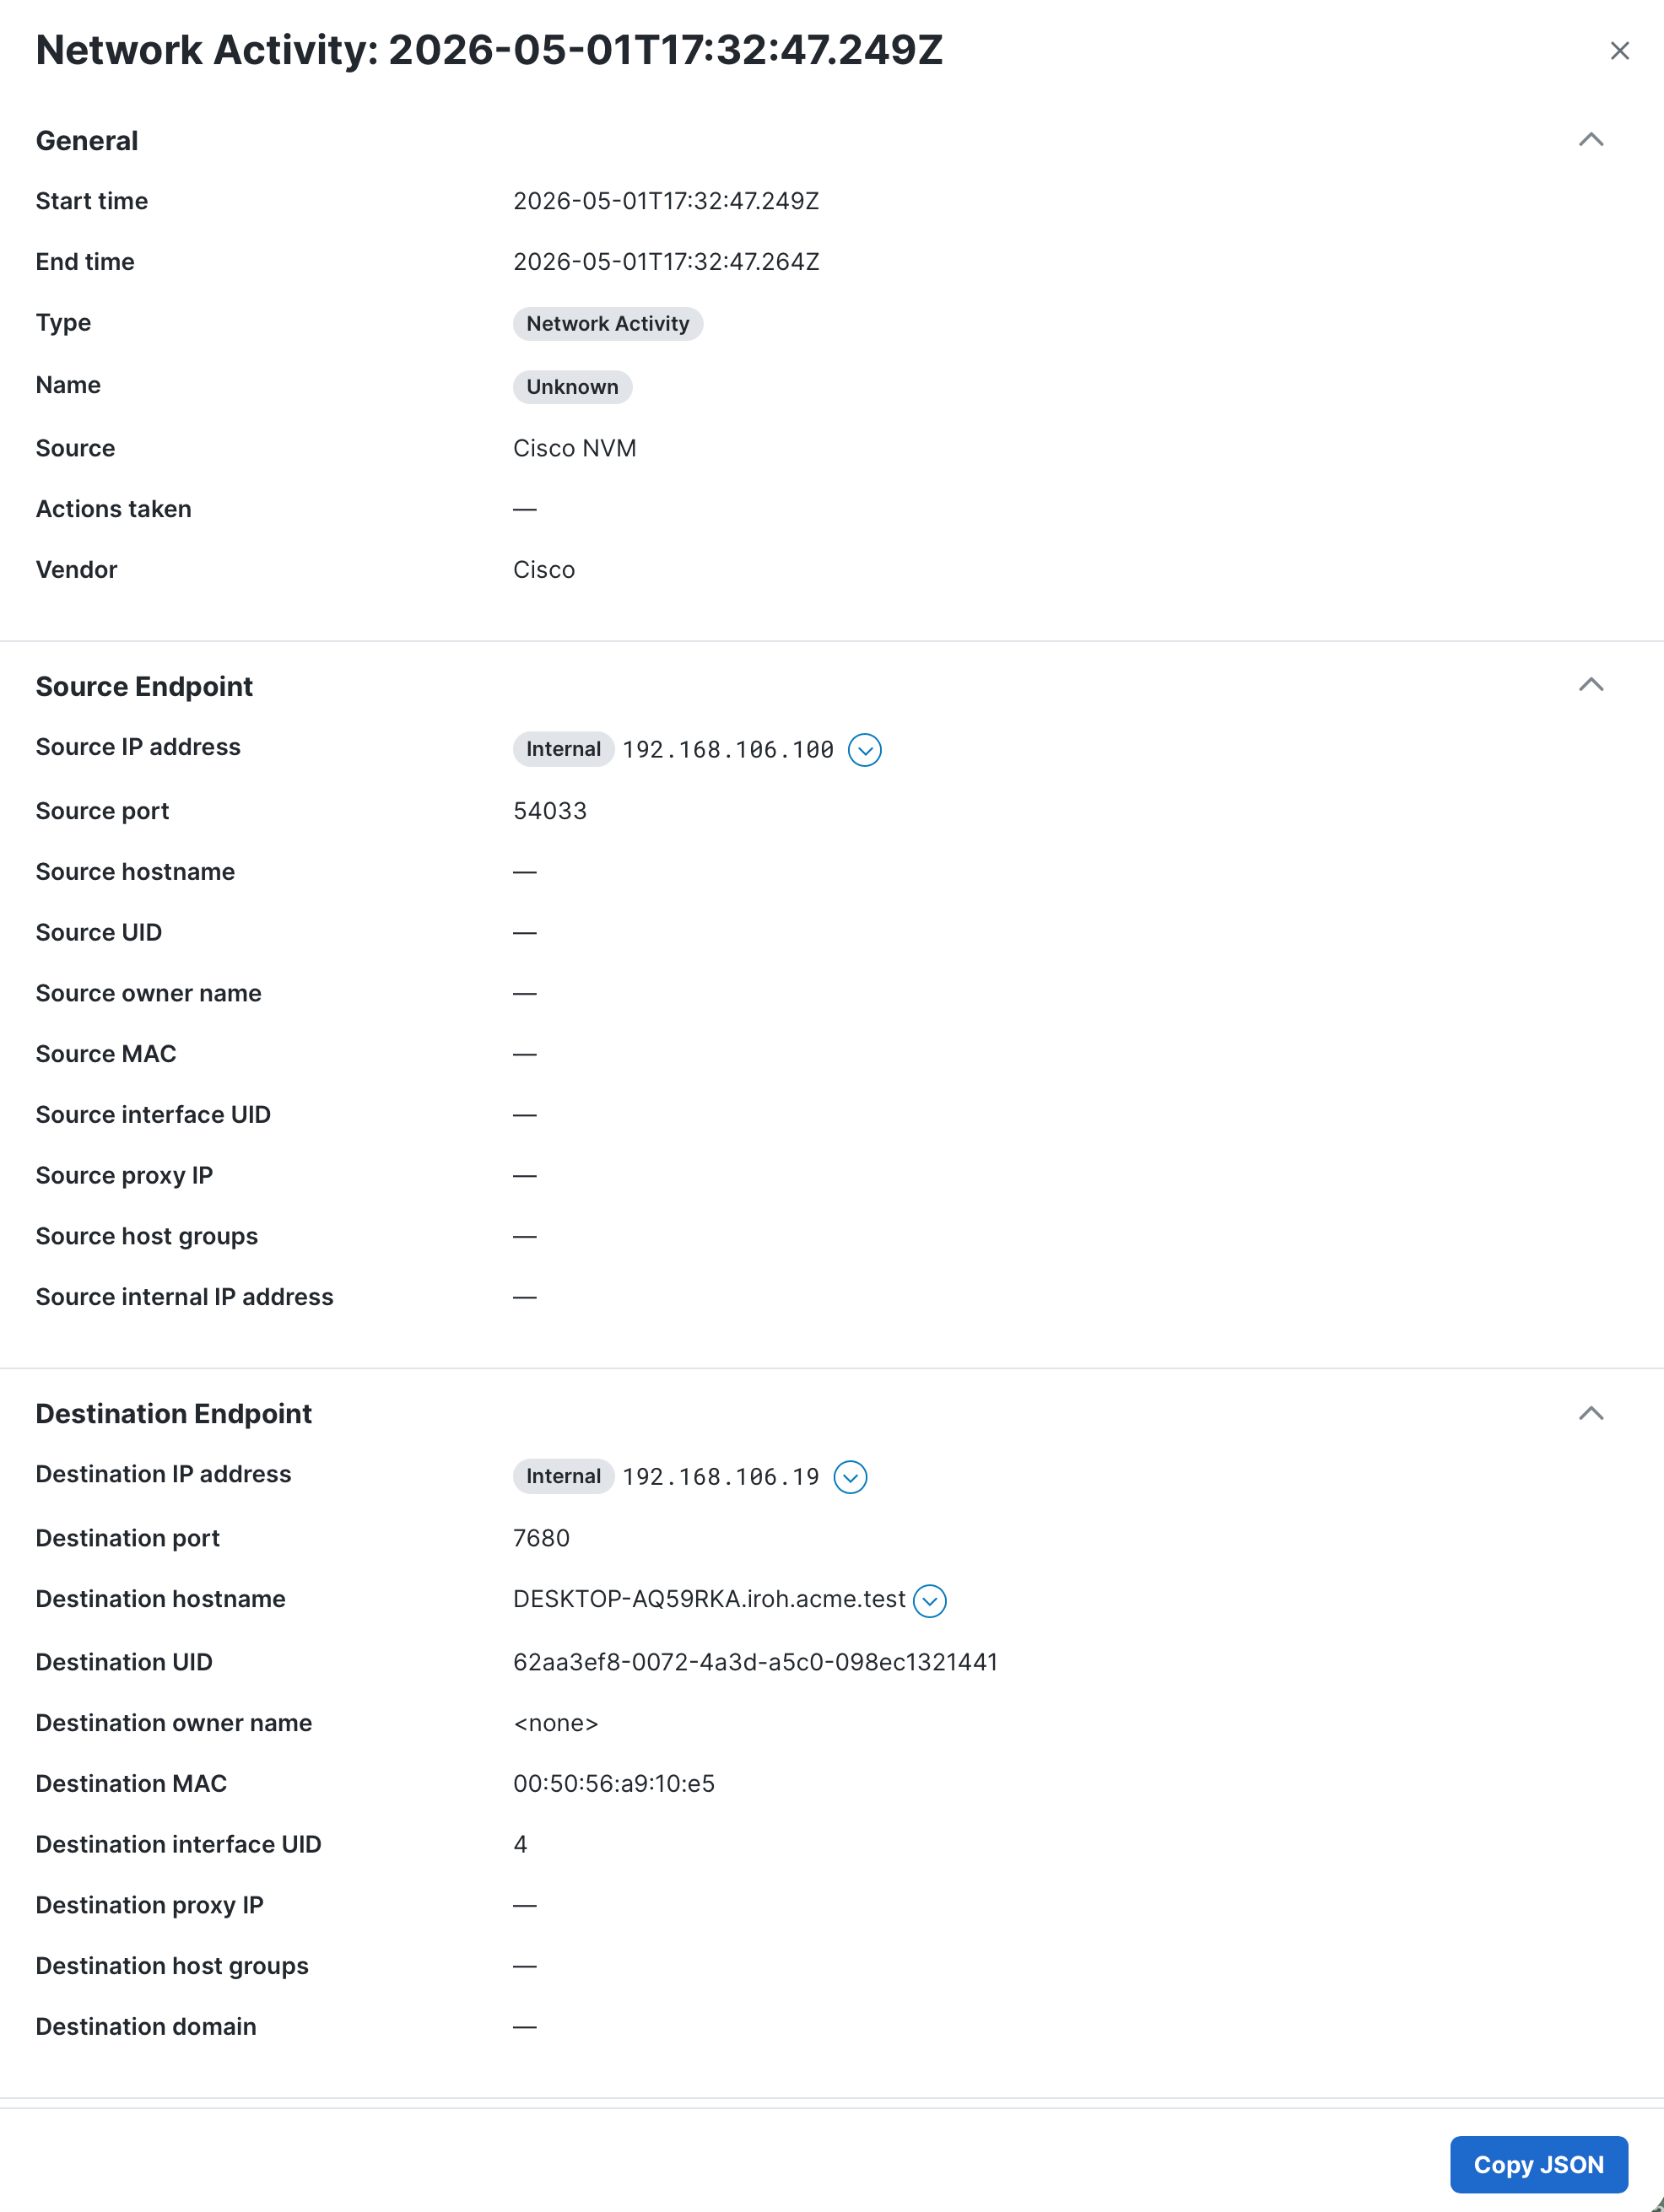
Click an activity link to open the activity details drawer with more information on the activity, including endpoint, traffic and connection, and device details. Click Copy JSON to copy the activity displayed in JSON format.