MITRE ATT&CK® Coverage Map
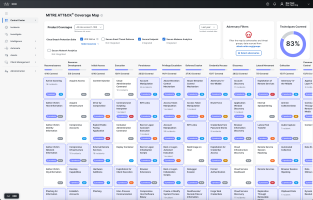
The MITRE ATT&CK® Coverage Map page provides a comprehensive visualization of how the Cisco Breach Protection Suite protects your organization against the tactics and techniques represented by the MITRE ATT&CK® Matrix for Enterprise v16.1. For more information on the ATT&CK versions, see Version History.
The product coverage mapping data is provided by Cisco Talos and Cisco's integration partners, and it is associated with the detection content for SentinelOne Singularity third-party product and the following Cisco products that are included in the Breach Protection Suite:
-
XDR Native (Network, Cloud, Identity, and Endpoint)
Note: The Additional Integrations area with the SentinelOne Singularity third-party integration check box is only displayed if your organization has SentinelOne Singularity integrated in Cisco XDR. For details on integrating SentinelOne Singularity, see SentinelOne Singularity Integration.
Choose Control Center > MITRE Coverage Map in the left navigation menu to open the MITRE ATT&CK® Coverage Map page and view the tactics and techniques that are covered by the Cisco and third-party products. By default, the coverage map displays the tactics and techniques for products that are integrated with Cisco XDR in your organization. You can filter the coverage map to display products that are not integrated for a comprehensive view of the coverage your organization would have if you integrate more products.
Note: Having visibility into a technique does not ensure detection or protection against all occurrences of the technique and the coverages shown in the map does not reflect your specific product configurations or settings.
The tactics are listed in the top row and all the associated technique cards are listed alphabetically under each tactic. For more information on tactics and techniques, see MITRE ATT&CK Matrix for Enterprise. The number of techniques covered by the selected products are indicated under the tactic and each technique card underneath displays the total number of supported products selected for the technique, the number of incidents that are impacted by the technique, and the color-coded risk score for the technique. Hover over the product tag to display a detailed list of selected products covered by the technique and you can hover over the risk score to display the severity of the risk. For more information on the risk scores, see Color and Icon Key. Click a tactic or technique card to open the tactic or technique drawer for a high-level summary of the tactic or technique in one place, including a list of products covered and a list of XDR Native sources that provide coverage for the tactic or technique, if applicable.
The status of the integration is displayed below each product check box (Integrated or Not Integrated). If a product is not integrated in Cisco XDR, you can configure the integration on the Integrations page. For more information on adding an integration, see Integrations.
XDR Native represents the Cisco XDR native telemetry that is sent from the following sources: Network, Cloud, Identity, and Endpoint. You can integrate network, cloud, and identity sources in Cisco Secure Cloud Analytics. For more information, see Cisco Secure Cloud Analytics. The Network Visibility Module data is sent to Cisco XDR from the Endpoint source if you install the default deployment on your endpoints. For more information on installing the default deployment and viewing endpoints data, see Default Deployments.
Note: The coverages that are indicated on the coverage map do not reflect the Secure Cloud Analytics and Network Visibility Module configurations in your environment. Ensure that you verify your configurations in Secure Cloud Analytics and Client Management.
The Secure Endpoint Configuration Insights drawer tells users what their organization's detection coverage is and what the current policy configuration for certain Secure Endpoint engines is. The Secure Endpoint Configuration Insights drawer lists the tactics, techniques, and sub-techniques that can be detected and/or blocked by each of the Secure Endpoint engines. It also includes the percentage of endpoints with those engines enabled, set in audit mode, or disabled, as well as the related policies. These listings provide a means for users to verify if their current configuration of Secure Endpoint is maximizing its protection capabilities.
Click the Configuration Insights link under the Secure Endpoint check box in the Product Coverages area to display the Secure Endpoint Configuration Insights drawer. You can also view Secure Endpoint configuration insights from a tactic or technique card in the coverage map. Any Secure Endpoint engines that have detections for the specified technique or sub-techniques and the technique's configuration mode is listed in a Secure Endpoint Policy Coverage section in the tactic and technique drawers.
Note: A message is displayed in the Secure Endpoint Configuration Insights drawer if you do not have Secure Endpoint integrated in Cisco XDR. Click Go to Integrations to open the Integrations page to configure the Secure Endpoint integration. For details, see Secure Endpoint Integration.
Choose the Secure Endpoint integration you want to review for MITRE ATT&CK® compliance and governance from the Select Secure Endpoint Integration drop-down list.
The MITRE ATT&CK® Coverage Map currently includes tactics, techniques, and sub-techniques for the following Secure Endpoint engines:
-
Note: The Orbital engine requires Secure Endpoint Advantage or Secure Endpoint Premier licensing tier in Secure Endpoint.
Note: The Secure Endpoint Configuration Insights drawer is meant to give users an overall sense of MITRE ATT&CK® coverage. It only takes into account the conviction mode of the above capabilities and not exclusions, block or allow lists, custom detections, or other settings.
The Secure Endpoint engine displays the following information:
| Engine Name |
The name of the Secure Endpoint capability associated with the displayed results. |
|
| Techniques and Sub-techniques |
The number of techniques and sub-techniques that are detected by this engine for the selected Secure Endpoint integration. Click the link to display the Covered Techniques & Sub-techniques drawer. For details, see Covered Techniques & Sub-techniques Drawer. |
|
| Endpoint Mode Distribution |
The total number and percentage of endpoints which have this capability in each of the different modes (Block, Protect, Enabled, Audit, and Disabled). A link to view the related policies is also included. |
|
| Endpoint Percentage Bar |
The top bar graph displays the percentage of the total number of endpoints that have block, protect, enabled, or audit mode turned on, or have all modes completely turned off. Refer to the Modes and Engines section of the Windows Connector: Required Policy Settings topic in the Secure Endpoint help for more information on conviction modes. Note: The block, protect, and enabled modes are the Cisco recommended modes. This bar graph has three colors, representing the different conviction modes:
Note: Configuration Insights only includes endpoints running an operating system that is supported by that engine when calculating the percentage of endpoints in each mode. |
|
| Endpoint Percentage Bar Legend |
The percentage of the total number of endpoints for each conviction mode. Note: If the percentage is between 0% and 1%, < 1% is displayed. Each listing consists of the color that represents the mode in the percentage bar, the mode percentage and the name of the conviction mode. |
|
| Total Endpoints Per Mode |
The total number of endpoints that are set to the specified conviction mode. It also has a link to the related policies. Click View policies to display the Policy drawer. For details, see Secure Endpoint Policy Drawer. |
|
Note: The total number of endpoints listed for each engine or capability mode listed in the Secure Endpoint Configuration Insights drawer will not match the total number of endpoints listed on the Computers page of Secure Endpoint. The reason for this discrepancy is that the total number of endpoints displayed in the Secure Endpoint Configuration Insights drawer are the total number of endpoints running an operating system supported by the specific engine or capability. Conversely, the total number of endpoints displayed on the Secure Endpoint's Computers page are all of the endpoints monitored, despite which operating systems are running on the endpoints.
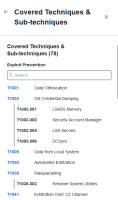
Click the techniques and sub-techniques link in the Secure Endpoint Configuration Insights drawer to display a list of all the techniques and sub-techniques detected by the Secure Endpoint engine in the Covered Techniques & Sub-techniques drawer.
The Covered Techniques & Sub-techniques drawer displays the following information:
| Covered Techniques & Sub-techniques Header |
The drawer header lists the total number of techniques and sub-techniques that can be detected by Secure Endpoint's engine. It also lists the name of the specific Secure Endpoint engine. |
| Search |
Use the Search field above the list of techniques and sub-techniques to find specific techniques and sub-techniques. The search is triggered as you enter the criteria. You can search for techniques and sub-techniques by ID or name. It will also accept partial names or numbers. Click the |
| Techniques and Sub-techniques |
All of the techniques and the associated sub-techniques that can be detected by the listed Secure Endpoint engine. Click a technique ID to display the technique drawer that provides more information on the technique. For details, see View Technique Details in Drawer. |
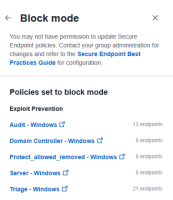
When you click the View policieslink next to the total number of endpoints in a mode, the policy drawer opens listing all of the Secure Endpoint policies that have this engine in that conviction mode.
The policy drawer displays the following information:
| Conviction Mode Name |
Displays the name of the conviction mode in use for these policies. The arrow located to the upper left corner will take you back to the Secure Endpoint Configuration Insights drawer. A link to the Secure Endpoint Best Practices Guide is located in the policy drawer description. |
| Policies List |
The policy list displays the name of all the Secure Endpoint policies that have this engine set to this conviction mode. Note: You must have access to Secure Endpoint and permissions to view the specific policy in order to view the policy details in Secure Endpoint. Click the policy name link to open the Secure Endpoint Policiespage in a new tab with details of the policy loaded. The number of endpoints affected by the policy is displayed next to the policy name. Note: To view the policy in Secure Endpoint, ensure that the organization selected in Secure Endpoint is the same as the Secure Endpoint integration selected in the Secure Endpoint Configuration Insights drawer. By default, the Secure Endpoint integration name is the Secure Endpoint organization name when it was integrated with Cisco XDR and it may change after the integration. If you are already logged in to Secure Endpoint, click Switch in the user profile drop-down menu in Secure Endpoint and choose the same organization selected in the Secure Endpoint Configuration Insights drawer. For details, see the Organization Switcher topic in the Secure Endpoint help. |
Refer to the Secure Endpoint Policies topic in the Secure Endpoint help for more information.
When you click a tactic, the tactic drawer opens where you can quickly view more information on the selected tactic, including product coverages and a list of incidents that are impacted by the selected tactic.
The tactic drawer displays the following information about the tactic:
|
Tactic name and ID |
The MITRE ATT&CK® tactic ID is displayed below the tactic name. For details on the tactic IDs, see Enterprise Tactics. |
|
Risk Score |
The risk score for the tactic indicates the probability of financial impact if the MITRE ATT&CK pattern is not mitigated--the higher the score, the higher the probability of impact. The risk score is the detection risk used to calculate the priority score for incidents and it is an internal calculation by Cisco's data science team based on the analysis of over 100,000 incidents costing customers upwards of 1 billion dollars. The risk score is color-coded based on the score and you can hover over the risk score to view the severity of the risk. For more information, see Color and Icon Key. |
|
The products that are checked in the coverage map and covered by the current tactic are listed in the Selected coverage area. The Additional coverage area displays products that are unchecked in the coverage map but they are covered by the current tactic. All the products in the Product coverages area are listed with the status of the integration in Cisco XDR and product links to learn more about the products. The sources listed next to XDR Native indicate the Cisco XDR sources that are covered by the current tactic. |
|
|
Secure Endpoint Policy Coverage |
Expand the panel to view the applicable Secure Endpoint configuration insights information for the current tactic. Refer to the Secure Endpoint Configuration Insights section above for more information. |
|
Description |
Expand the panel to view the description of the tactic. The description is provided by MITRE ATT&CK®. For a list of all the tactic descriptions, see Enterprise Tactics. |
|
Incidents |
Expand the panel to view the five most recent incidents that are impacted by the current tactic, with the creation date and the status of the incident listed for each incident. The total number of incidents for the tactic is also displayed. Click the incident link to open the incident detail in a new tab or click View all to open the Incidents page with a filtered list of incidents that are impacted by the current tactic in a new tab. |
|
View on the MITRE ATT&CK® website |
Click the link to open the MITRE ATT&CK® website in a new tab for more information on the current tactic. |
To close the drawer, click the (Close) icon in the upper right corner.
When you click a technique card, the technique drawer opens where you can quickly view more information on the selected technique, including product coverages and a list of incidents that are impacted by the selected technique.
The technique drawer displays the following information about the technique:
|
Technique name, ID, and tactics |
The MITRE ATT&CK® technique ID and related tactics are displayed below the technique name. For details on the technique codes, see Enterprise Techniques. |
|
Risk Score |
The risk score for the technique indicates the probability of financial impact if the MITRE ATT&CK pattern is not mitigated--the higher the score, the higher the probability of impact. The risk score is the detection risk used to calculate the priority score for incidents and it is an internal calculation by Cisco's data science team based on the analysis of over 100,000 incidents costing customers upwards of 1 billion dollars. The risk score is color-coded based on the score and you can hover over the risk score to view the severity of the risk. For more information, see Color and Icon Key. |
|
Product Coverage |
The products that are checked in the coverage map and covered by the current technique are listed in the Selected coverage area. The Additional coverage area displays products that are unchecked in the coverage map but they are covered by the current technique. All the products in the Product Coverages area are listed with the status of the integration in Cisco XDR and product links to learn more about the products. The sources listed next to XDR Native indicate the Cisco XDR sources that are covered by the current technique. |
|
Adversaries |
Expand the panel to view a list of adversaries that use the current technique. The adversaries that are checked in the Adversary Filters drawer and use the current technique are listed in the Filtered Adversaries area. The Additional Adversaries area displays adversaries that are unchecked in the Adversary Filters drawer but they use the current technique. The number of selected adversaries for the current technique out of the total number of filtered adversaries is displayed next to Filtered Adversaries. The total number of additional adversaries that are not selected is displayed next to Additional Adversaries. |
|
Secure Endpoint Policy Coverage |
Expand the panel to view the Secure Endpoint configuration insights information for the current technique. Refer to the Secure Endpoint Configuration Insights section above for more information. |
|
Description |
Expand the panel to view the description of the technique. The description is provided by MITRE ATT&CK®. For a list of all the technique descriptions, see Enterprise Techniques. |
|
Sub-techniques |
Expand the panel to view a list of the sub-technique IDs and names for the current technique. The total number of sub-techniques supported by the technique is displayed next to the title. |
|
Incidents |
Expand the panel to view the five most recent incidents that are impacted by the current technique, with the creation date and the status of the incident listed for each incident. The total number of incidents for the technique is also displayed. Click the incident link to open the incident detail in a new tab or click View all to open the Incidents page with a filtered list of incidents that are impacted by the current technique in a new tab. |
|
View on the MITRE ATT&CK® website |
Click the link to open the MITRE ATT&CK® website in a new tab for more information on the current technique. |
To close the drawer, click the (Close) icon in the upper right corner.
You can filter the MITRE ATT&CK coverage map by product, risk score, and incident creation date, and adversaries to narrow the techniques displayed on the coverage map.
In the Product Coverages area, check the check boxes next to the integrations to filter the tactics and techniques covered by the selected integrations that are displayed on the page.
By default, the check boxes for the integrated products and all the XDR Native sources are checked. Check the check boxes next to the products that are not integrated to view the possible tactics and techniques that can be covered if you integrate more products. For more information on integrating products, see Integrations.
Note: The Additional Integrations area with the SentinelOne Singularity third-party integration check box is only displayed if your organization has SentinelOne Singularity integrated in Cisco XDR. For details on integrating SentinelOne Singularity, see SentinelOne Singularity Integration.
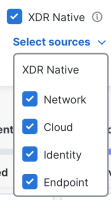
All the sources under the XDR Native check box are automatically checked by default, displaying the coverage information for all the sources that send telemetry data to Cisco XDR. To filter the sources, click the Select sources drop-down list and check or uncheck the check boxes next to the sources you want to include or exclude on the page.
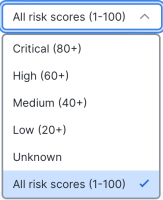
The risk scores, including the color-coded severity of the risk scores, are displayed on the technique cards in the coverage map. You can filter the techniques based on the severity level of the risk score displayed on the technique cards (Critical, High, Medium, Low, Unknown, or All risk scores). For details on the severity, see Color and Icon Key.
Click the Minimum risk score drop-down list and choose the minimum severity of the risk score you want displayed in the coverage map. Only techniques with a risk score greater or equal to the selected severity will be shown. All risk scores is selected by default.
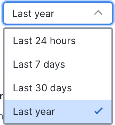
The number of incidents promoted and impacted by the tactics and techniques during the specified date range are displayed on the technique cards. By default, the number of incidents promoted and impacted within the last year is displayed. You can narrow the number of incidents based on the specific time frame using the incident created date drop-down list in the upper right corner of the Product Coverages area.
Click the Incident created date drop-down list and choose the date range for the number of incidents you want displayed on the technique cards and the list of incidents displayed in the tactic or technique drawer. For example, choose Last 30 days if you want to display the number of incidents that were promoted and impacted by the tactics and techniques in the last 30 days.
To display a detailed list of incidents for a specific tactic or technique, click the tactic or technique card and the incidents are listed in the technique drawer.
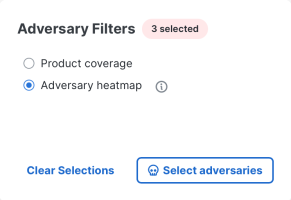
The Adversary Filters area allows you to filter the techniques in the coverage map by the MITRE ATT&CK adversaries and threat groups. Adversaries are known threat actors that are tracked by MITRE ATT&CK. For more information, see MITRE ATT&CK Groups. Filtering by adversaries allows you to view the techniques used by the adversary groups and whether the selected products protect you against the techniques used by the adversary groups.
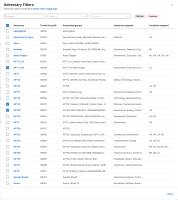
Click Select adversaries to open the Adversary Filters drawer for a list of the adversary names, IDs, associated groups, industries targeted by the adversary, and countries targeted by the adversary. Check the check boxes next to the adversaries to filter the coverage map to display the techniques that are used by the selected adversary groups. The total number of adversaries available and the number of adversaries selected are displayed next to the Country drop-down list.
Search Adversaries
Use the Search text box in the upper portion of the drawer to narrow the display of adversaries. Enter the search criteria in the Search text box to search for adversaries by name, threat group ID, or associated groups. The adversaries that match your search criteria are displayed in the list below.
Filter Adversaries by Industry
You can filter the list of adversaries by industries that are targeted by the adversary groups. The industry data is extracted from the description of the adversary from MITRE ATT&CK.
In the Adversary Filters drawer, click the Industry drop-down list and check the check boxes next to the industry to filter the adversaries that are displayed in the drawer. The number of techniques that target the industry is listed next to each industry. Check the Unknown check box if you want to filter the list of adversaries by industries that have not been identified.
Filter Adversaries by Country
You can filter the list of adversaries by countries that are targeted by the adversary groups. The country data is extracted from the description of the adversary from MITRE ATT&CK.
In the Adversary Filters drawer, click the Country drop-down list and check the check boxes next to the country to filter the adversaries that are displayed in the drawer. The country code and the number of techniques that target the country is listed next each country. Check the Unknown check box if you want to filter the list of adversaries by countries that have not been identified.
Adversary Heatmap
After you select the adversaries, the Adversary heatmap radio button is selected by default and the color of the technique cards in the coverage map is updated to red, indicating the number of adversaries that uses each technique. For more information on the different shades of red, click the ![]() (Information) icon next to the Adversary Heatmap radio button to display a legend.
(Information) icon next to the Adversary Heatmap radio button to display a legend.
Click the Product coverage radio button to apply a purple color to the technique cards, indicating that the products selected in the Product Coverages area protect you against the techniques used by the selected adversaries.
The coverage chart in the upper right corner displays the techniques and tactics covered by the selected products and adversaries in two views: Techniques and Tactics. By default, the Techniques chart is displayed and the Tactics chart is displayed automatically when you apply the adversary filters.
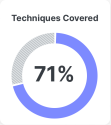
The Techniques tab displays a donut chart that illustrates the percentage of techniques covered by the products checked in the Product Coverages area. Hover over the percentage to display the number of techniques covered out of the total number of techniques available. The number of techniques do not include duplicate techniques displayed under the row of tactics in the coverage map.
The chart is updated as you check and uncheck the product check boxes in the Product Coverages area.
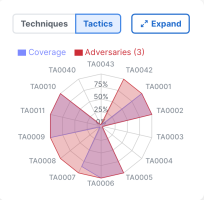
The Tactics tab displays a radar chart that illustrates all the tactics with an overlay of the following:
-
Percentage of tactics covered by the products checked in the Product Coverages area
-
Percentage of tactics used by the adversaries selected in the Adversary Filters area
The points on each spoke of the radar chart represent the percentage of the total number of techniques used by adversaries or covered by the products. Hover over a tactic ID to display the tactic name, number of techniques covered by the selected products, and the number of selected adversaries used by the tactic. The number of adversaries selected are displayed next to Adversaries in the legend. The overlay of the selected product coverage and the selected adversaries in the radar chart indicates whether the products selected cover the tactics that are used by the adversaries. Click Expand in the upper right corner to open the radar chart in a popup and display a larger view of the radar chart.
The radar chart is updated as you check and uncheck the product check boxes in the Product Coverages area or check and uncheck the adversaries in the Adversary Filters drawer.
