Navigate Cisco XDR
This topic describes how to navigate to the main features in the Cisco XDR.
Note: The screenshots presented in the Help topics may not always reflect the latest product names or UI enhancements.
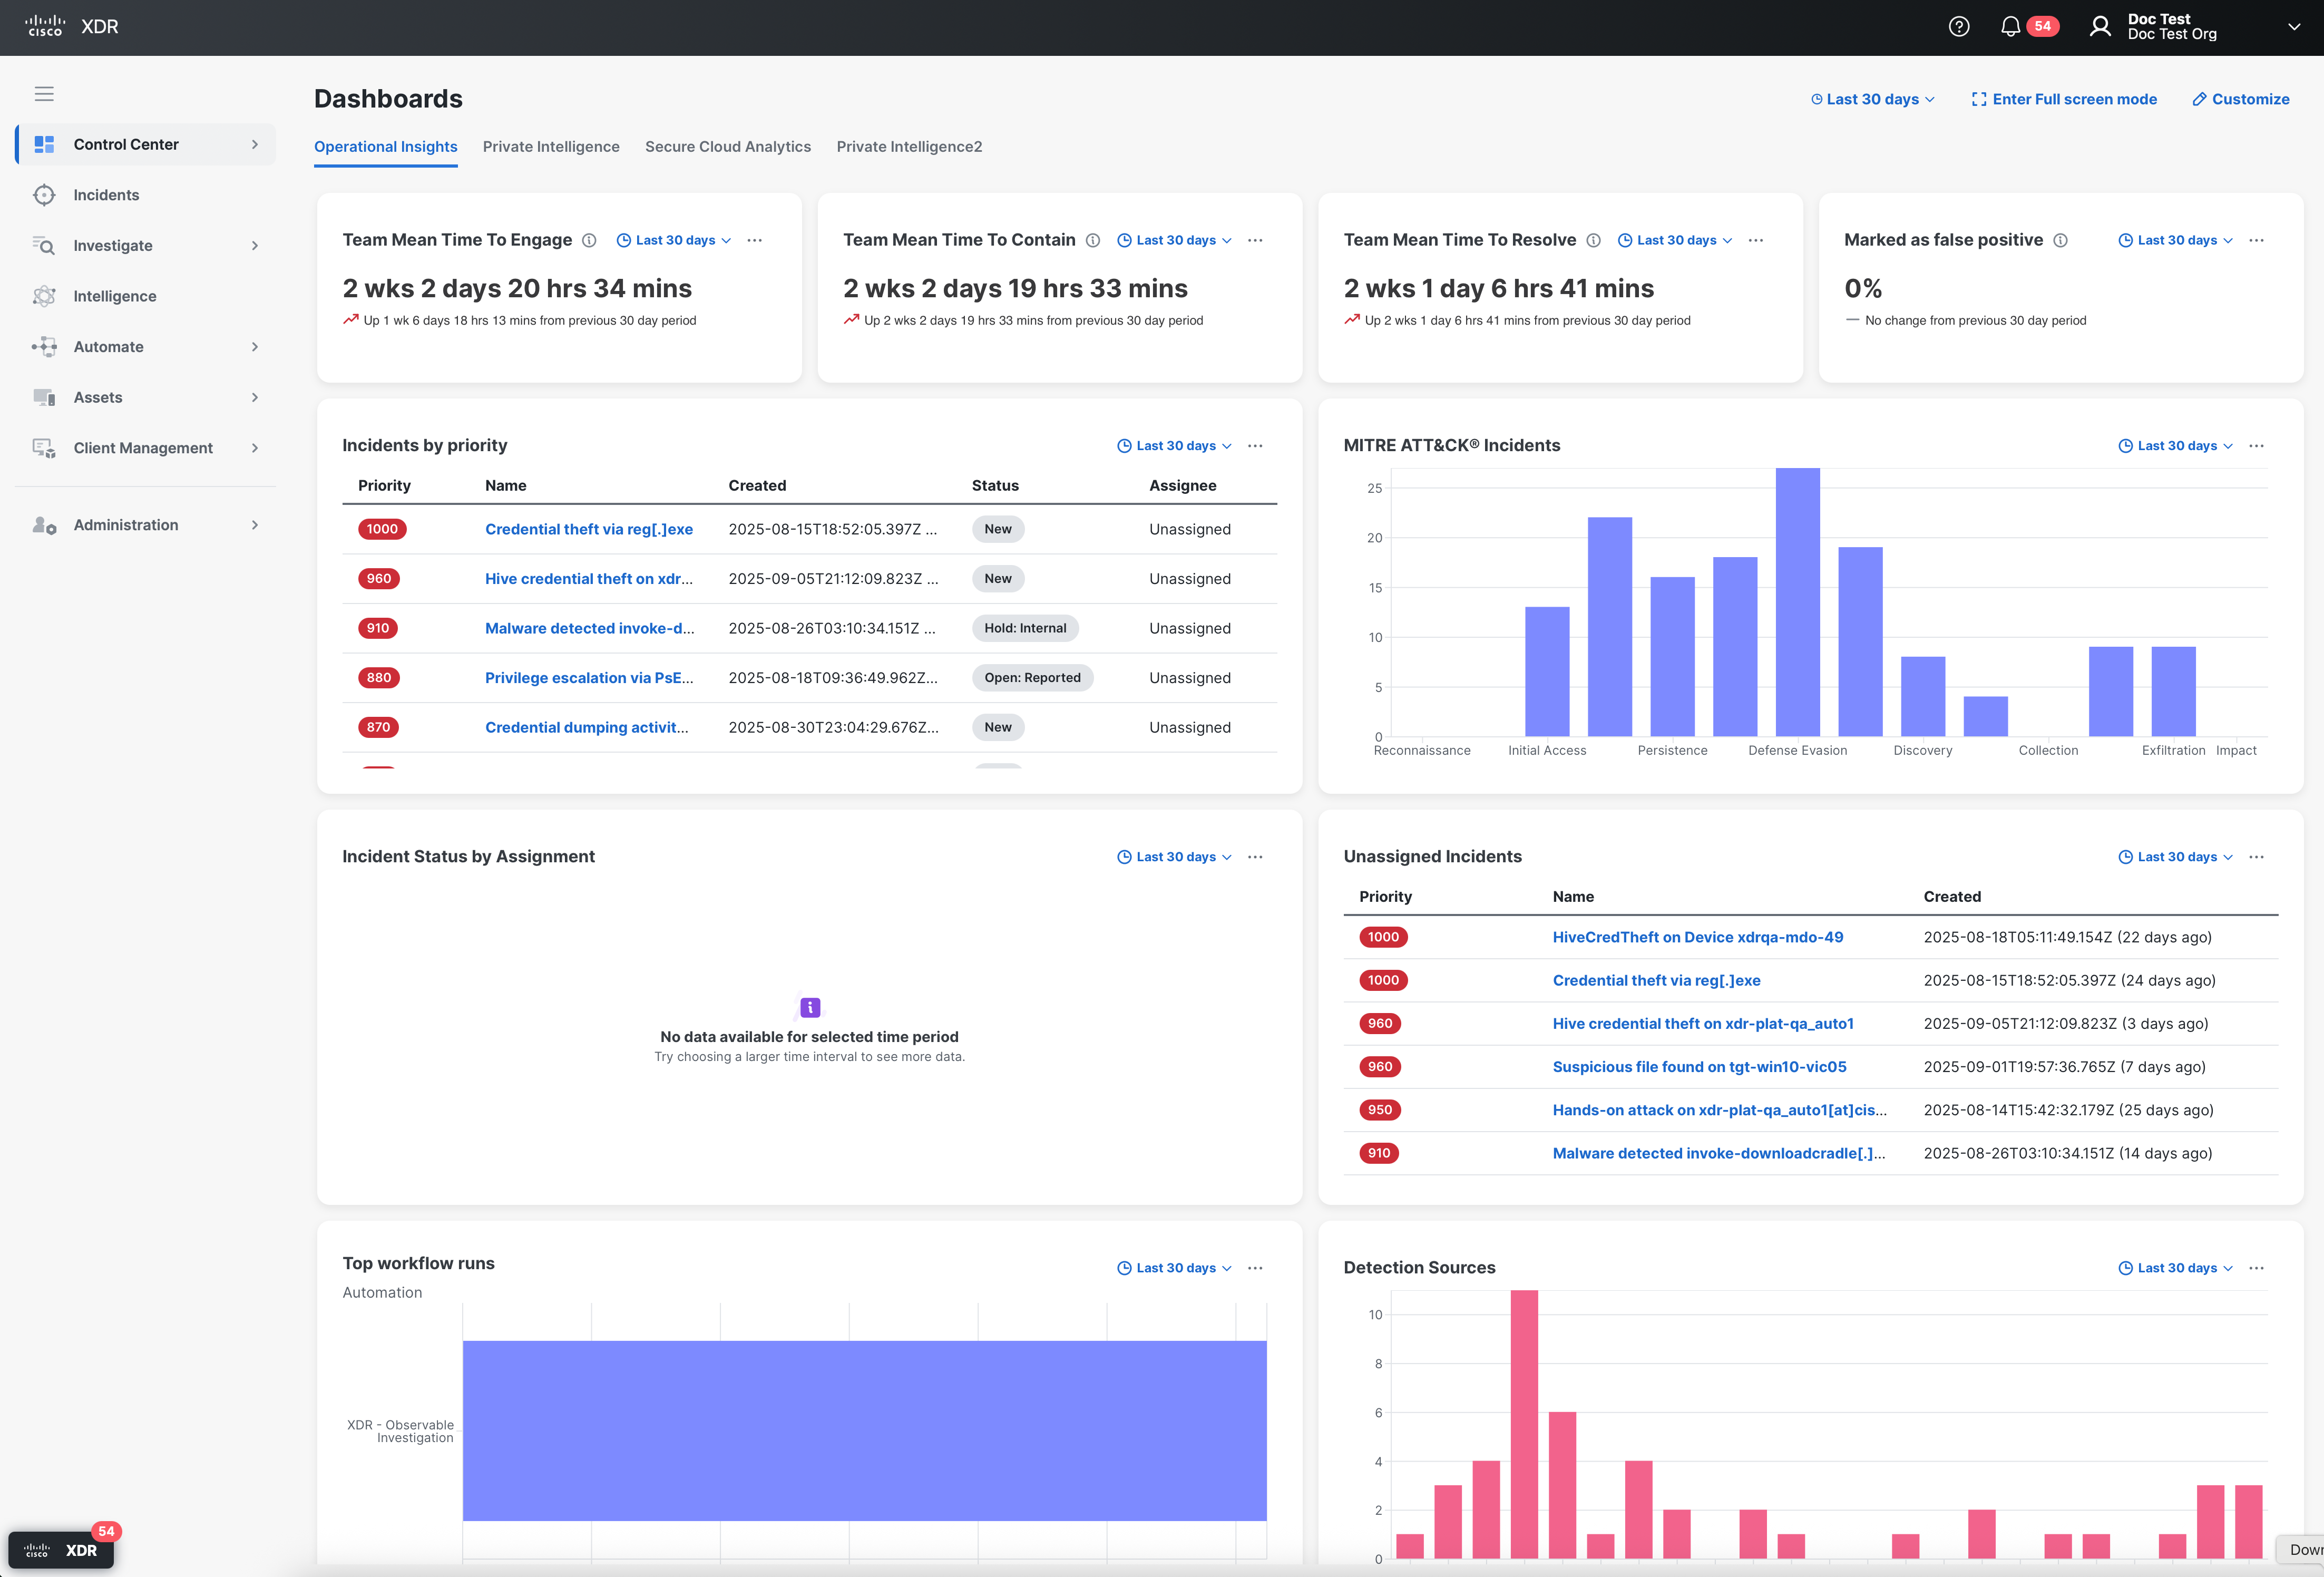
By default, the Cisco XDR left navigation menu is collapsed and you must hover over a menu icon to display the navigation menus. To keep the navigation menu expanded, click the ![]() (Splunk XDR Menu) icon in the upper left corner of the navigation menu. The following is a list of the navigation menus in Cisco XDR:
(Splunk XDR Menu) icon in the upper left corner of the navigation menu. The following is a list of the navigation menus in Cisco XDR:
The Cisco XDR Control Center pages provide visibility and aggregate, actionable intelligence across your organization and a comprehensive visualization of the tactics and techniques that are covered by the Cisco Breach Protection Suite products.
See Control Center for more information.
The Cisco XDR Incidents list helps you minimize the time spent on detection and response of correlated security events by providing the most critical information needed to detect, triage, investigate, and respond all in one place. With risk-based prioritization of security detections, you can focus on the most critical incidents and view recommendations that enable you to immediately diagnose, contain, and remediate the incident.
With Cisco XDR Incidents feature, you can:
-
View a list of incidents, prioritized by severity and risk.
-
Open the Incident drawer and view a high-level summary of the incident in one place.
-
Dive deeper into the incident details to gain an understanding of the threat and quickly triage and remediate it.
Click Incidents in the left menu to view the automatically enriched incidents that have been promoted to Cisco XDR.
See Incidents for more information.
In an intelligence-driven incident response, a piece of disseminated information may be the starting point for a security team to investigate the impact of a known piece of malware. The Cisco XDR Investigate feature is used to search suspicious indicators of compromise (IOCs) such as emails, log messages, domains, URLs, and IPs, and extract observables for enrichment.
Cisco XDR reaches out to all of the configured sources (configured modules) and finds the disposition for each observable. Once a target has been identified, you can direct attention immediately to the target to gain contextual knowledge of exactly which observable(s) the target has communicated with.
Click Investigate in the navigation menu to begin an investigation.
See Investigate for more information.
The Cisco XDR Intelligence feature provides users the ability to search for stored threat intelligence from the public, as well as your private, threat intelligence stores based on the Cisco Threat Intelligence Model. It includes the judgments, indicators, events, and feeds based on the data that has been extracted from the continuous enrichment of our threat intelligence sources and deemed most relevant to incident response.
In the navigation menu, expand Intelligence and choose to view Judgments, Indicators, Events, and Feeds.
See Intelligence for more information.
The Automation feature provides a framework to automate security processes such as threat investigation, hunting and remediation to strengthen operational efficiency and precision.
Cisco XDR Automation enables you to define workflows to reflect your typical security processes; the automation steps (activities), the logic or flow between these steps, and how to flow data from one step to the next. With Cisco XDR, you can leverage Cisco and third-party multi-domain systems, applications, databases, and network devices in your environment to create these workflows.
See About Automation for more information.
The Cisco XDR Assets feature provides a unified view of the devices and users in your organization by consolidating inventories from integrated data sources, such as Duo, Secure Endpoint, Orbital, Umbrella, and Meraki.
See Assets for more information.
The Cisco XDR Client Management feature is the next generation Secure Mobility Client that combines the existing features of both AnyConnect and Secure Endpoint with a Cloud Management solution in a single unified end-user interface.
See Client Management for more information.
The Administration pages are used to view your account information, view your notifications, manage incident response playbooks, configure devices and API clients, and manage existing users and invite users to your Cisco XDR organization. You can also view the security products that are integrated with Cisco XDR on the Integrations page. Each source of global or local intelligence is provided by an integration and is linked via an API key.
See Administration for more information.
Cisco XDR is both a centralized console and a distributed set of capabilities that unify visibility, enable automation, accelerate incident response workflows, and improve threat hunting. These distributed capabilities are presented in the form of applications (apps) and tools in the Cisco XDR ribbon.
The ribbon is located in the lower portion of the page, and persists as you move between the Cisco XDR pages in your environment.

Use the ribbon to access the casebook and other apps, search observables for enrichment, view notifications, and view incidents. For more information, see Ribbon.
Click the ![]() (Help) icon in the upper right corner on the Cisco XDR header and choose Help to access the online Help topics to learn more about the specific Cisco XDR page. The Cisco XDR Help has a built-in search function that allows you to quickly find important information using a search string. For details, see Documentation Search.
(Help) icon in the upper right corner on the Cisco XDR header and choose Help to access the online Help topics to learn more about the specific Cisco XDR page. The Cisco XDR Help has a built-in search function that allows you to quickly find important information using a search string. For details, see Documentation Search.
The Cisco Support Assistant options are also available from the drop-down menu as an in-product support tool that provides built-in integration of Cisco Support Assistant Chrome Extension into the Cisco XDR UI without the need for installation of a Chrome browser extension. The support tool integrates Cisco Technical Assistance Center (TAC) support functions directly into the UI and it enables easy and quick access to Cisco support without leaving the UI.
-
Open onboarding checklist - A guided onboarding experience with videos and other collateral to help you get started with Cisco XDR.
-
Open support case - Provides an intuitive, context-aware interface for customers to open TAC cases directly from the UI.
-
Record screen - Allows you to record on-screen activities to demonstrate issues visually during case submission. These recordings help TAC engineers to quickly understand the problem context, leading to more efficient troubleshooting.
-
Upload local file - Simplifies the process of uploading diagnostic files and configuration logs to Cisco TAC. Secure file transfer is integrated directly within the UI. This makes it easy to share your files while maintaining compliance and privacy standards.
-
Open case listing - View and track all your support cases in one place, with real-time status and quick access to details.
To access product-specific documentation for the integrations, see Cisco and Third-Party Integrations and Supported Capabilities.
Click the ![]() (Notifications) icon in the upper right corner on the Cisco XDR header to display your notifications in the Notifications popup. A notification is sent to you if an incident or approval task is assigned to you by another user or if an Automation workflow or rule is temporarily disabled.
(Notifications) icon in the upper right corner on the Cisco XDR header to display your notifications in the Notifications popup. A notification is sent to you if an incident or approval task is assigned to you by another user or if an Automation workflow or rule is temporarily disabled.
The badge next to the icon displays the number of unread notifications. The number of unread notifications is updated when you change the status of the notifications as read or unread.
-
Click the
 (Mark as Read) icon to change the status of the unread notification to read.
 -
Click the
 (Mark as Unread) icon to change the status of the read notification to unread.
 -
Click the
 (Mark all as read) icon to change the status of all the unread notifications to read.
 -
Click the
 (Dismiss) icon to remove the notification from the Notifications popup and Notifications page.
You can search and filter all your notifications to display only those notifications you want to view in the Notifications popup. Click Clear filters to remove the search criteria and filter.
To search for notifications, enter the search criteria in the Search text box in the Notifications popup to search for notifications by type or details. The notifications that match your search criteria are displayed in the Notifications popup.
To filter the notifications, click the Date drop-down and choose the date range for the notifications you want displayed in the Notifications popup.
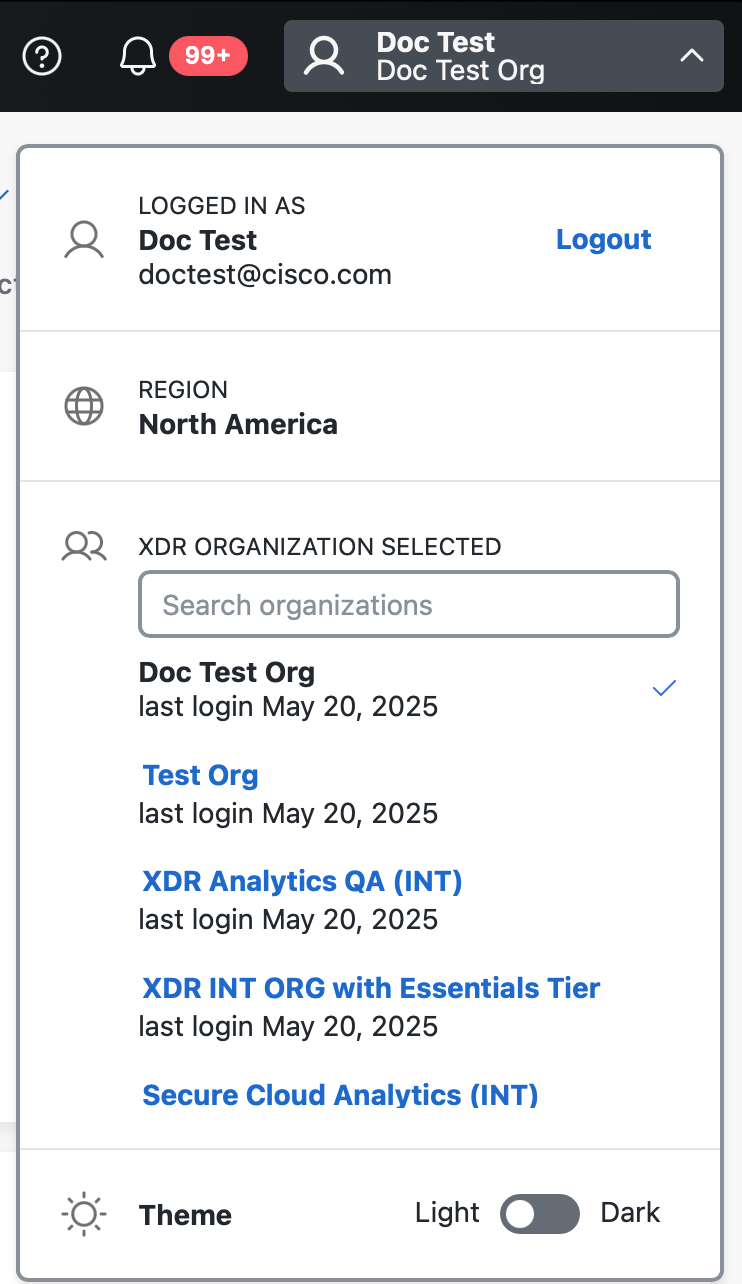
Click the drop-down arrow next to your organization and role in the upper right corner of the Cisco XDR header to view your user name and log-in credentials.

Use the User Profile drop-down list to log out of the platform, view the current region, switch to a different organization, and change the color theme of the Cisco XDR user interface.
Click Logout next to your user name to log out of Security Cloud Sign On account and Cisco XDR.
If you are a member of two or more organizations within a region, you can switch to a different organization in the User Profile drop-down menu by clicking the organization link. Once you choose an organization, you are automatically log in to Cisco XDR for the selected organization.
Search Organizations
If there are seven or more organizations listed in the User Profile menu, a Search organizations text box is displayed. Enter the search criteria in the Search organizations text box to search for organizations by organization name. The organizations with the name that match your search criteria are displayed in the User Profile menu.
You can choose the color theme in which to display the Cisco XDR user interface. The default color theme displays a light background; dark color theme displays a dark background.
To change the color theme, click the Light or Dark.
One of the most important user interface elements is the use of color and icon to indicate disposition and threat level. Dispositions are indicated by the icon and color combination; priority and risk are indicated by the color. The color and icon scheme is used throughout the user interface.
Dispositions
The following is a list of icon and color combinations used to indicate dispositions:
| Icon and Color | Disposition |
|---|---|
|
|
Malicious |
|
|
Suspicious |
|
|
Unknown |
|
|
Clean |
Note: The Unknown disposition is only available in Cisco XDR ribbon and Pivot menus.
Priority Score
The following is a list of colors used to indicate the priority levels:
| Color | Priority Score |
|---|---|
 (red) (red) |
800 and above |
 (orange) (orange) |
600 to 799 |
|
|
400 to 599 |
|
|
399 and below |
|
|
— |
Risk Score
The following is a list of colors used to indicate the risk scores:
| Color |
Risk Score |
Severity |
|---|---|---|
 (red) (red) |
80 to 100 |
Critical |
 (orange) (orange) |
60 to 79 |
High |
|
|
40 to 59 |
Medium |
|
|
0 to 39 |
Low |
|
|
N/A |
Unknown |


 (yellow)
 (blue)
 (grey)