Overview
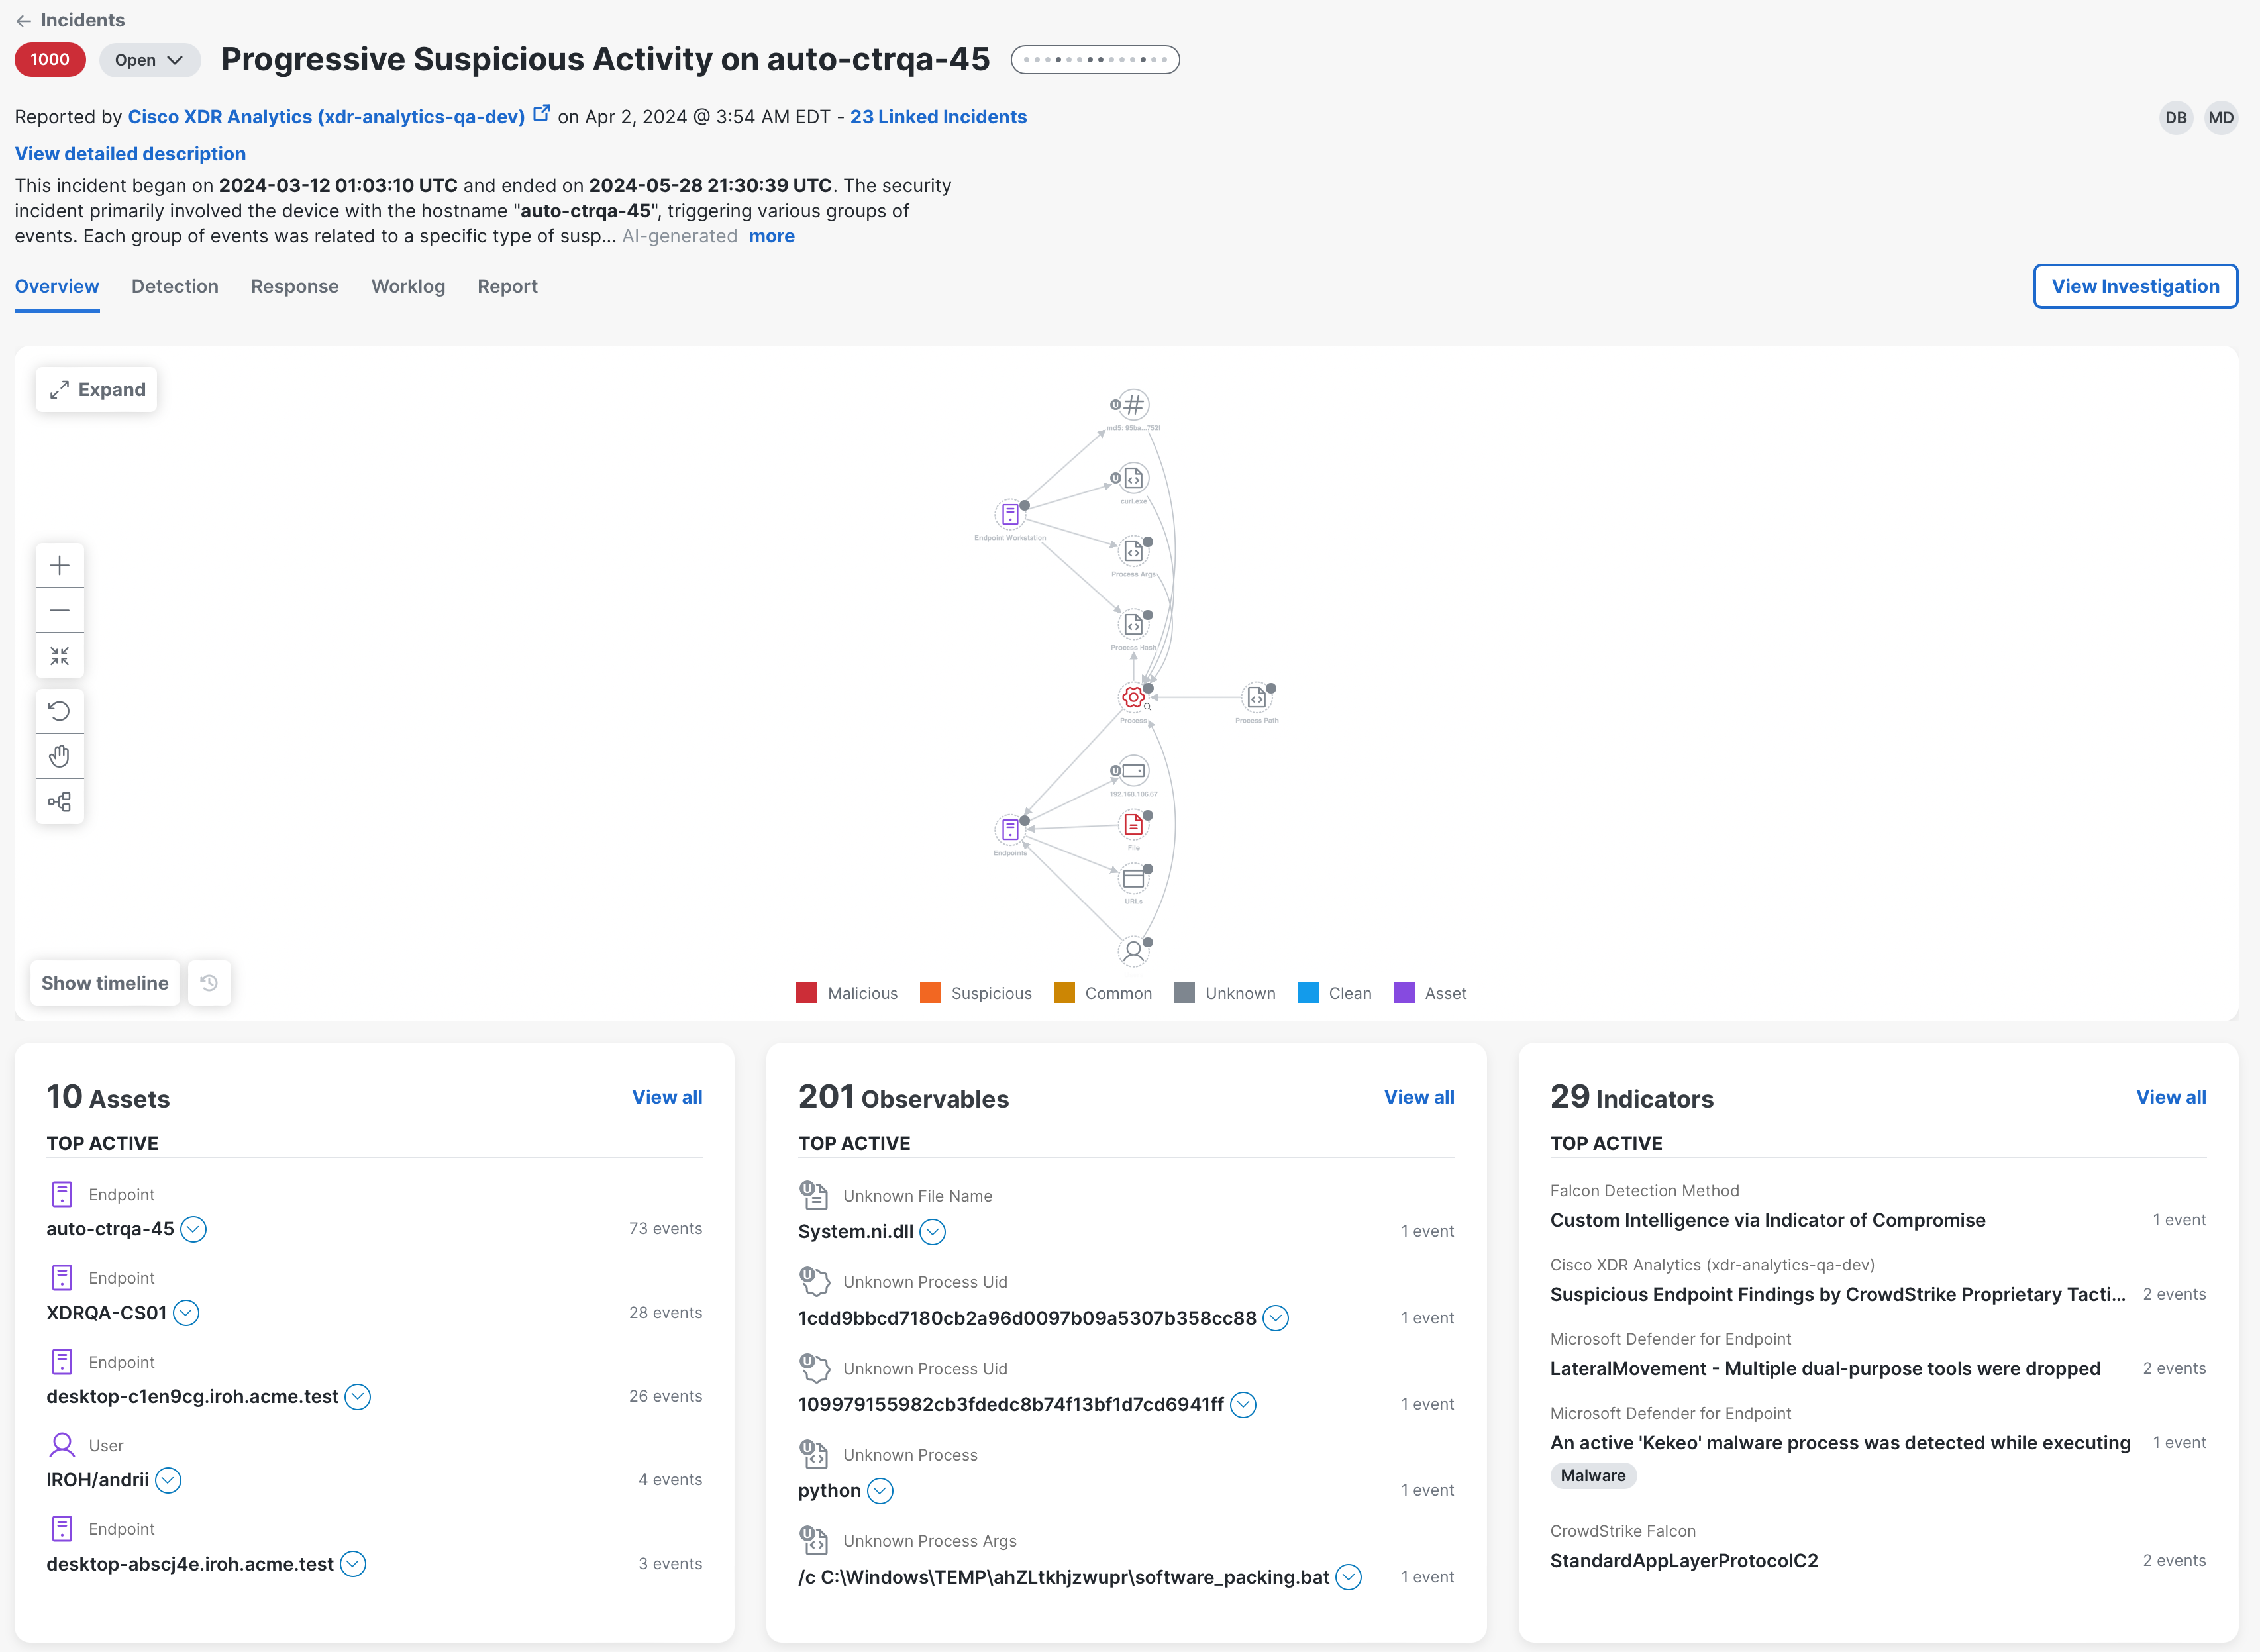
The Overview tab in the incident detail provides a high-level view of the event investigation in the attack graph and a summary of the top active assets, observables, and indicators based on the total number of events for the selected incident.
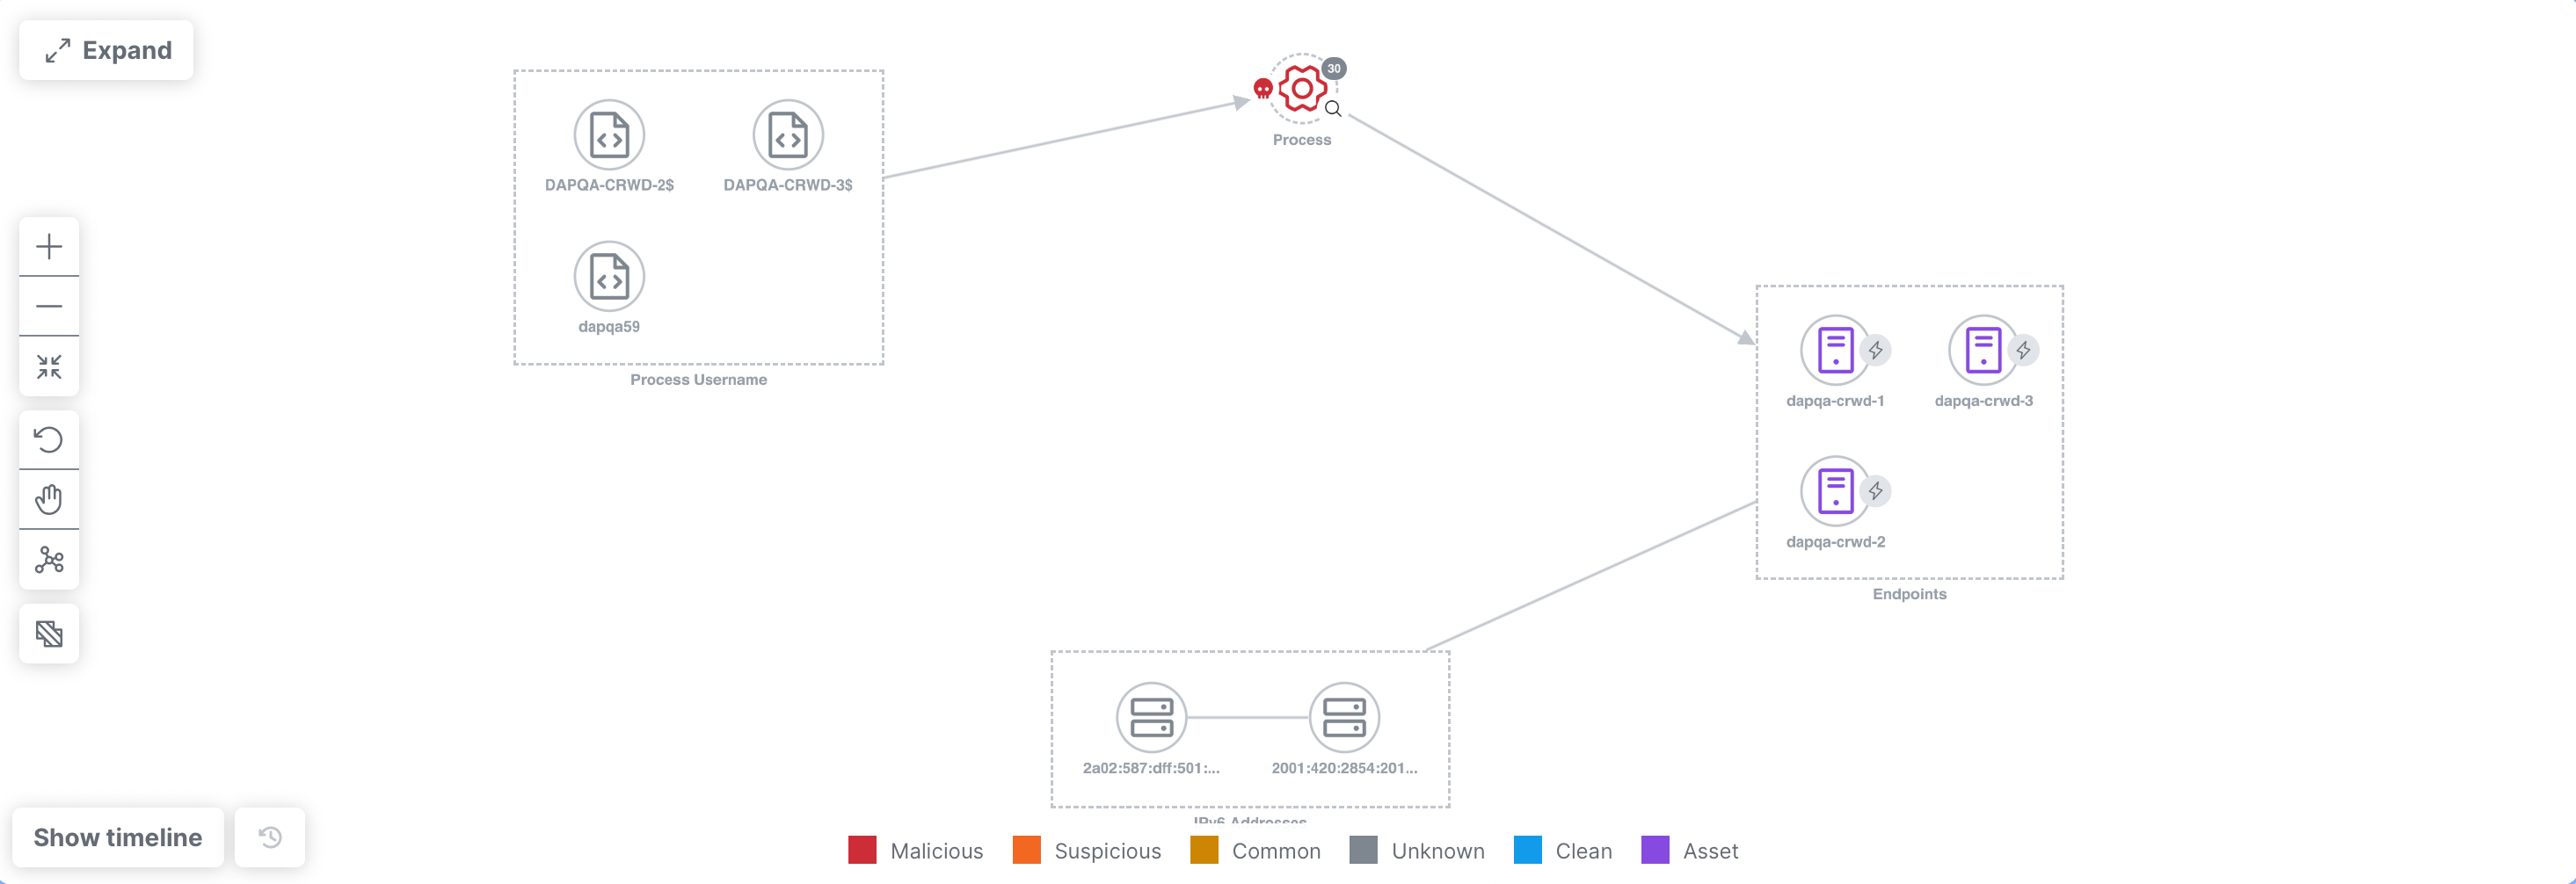
The attack graph in the upper portion of the Overview tab displays a compacted relationship view of the investigation of events that caused the incident to be promoted. This view provides a linear progression of the attack at a high level.
Note: If the graph has reached its maximum load limit, the graph will not load and a message is displayed. You can continue to access other incident details.
The nodes on the graph represent the devices, entities, and resources that the threat has targeted, as identified by one or more observables (see Graph Icon Descriptions for more information). When targets and observables have the same strong identifier and relationship, they are unified into one node to simplify the view and reduce the noise on the graph. The badge on the node displays the number of objects that have been unified and the disposition icon is displayed on the left side of the node, if applicable. For details, see Color and Icon Key. The ![]() (Actions Taken) icon on the right side of the node indicates that remedial actions have been executed by the integrated Endpoint Detection and Response (EDR) source for the device.
(Actions Taken) icon on the right side of the node indicates that remedial actions have been executed by the integrated Endpoint Detection and Response (EDR) source for the device.
The relationship between nodes is shown on the label of the directional arrow that connects to other nodes. When there are multiple nodes that have been unified into one object and share a directional arrow, you can hover over one node to highlight the other nodes that have a relationship to it.
Right-click a node on the graph to open the Pivot menu that enables you to take action on the node. You can perform some actions directly in the Pivot menu or pivot to the integrated product to perform additional actions. If the nodes are grouped, double-click the grouped node to expand it and then right-click a node to open the Pivot menu.
Click the icons to adjust how you want the graph to be displayed:
|
Icon |
Description |
|---|---|
|
|
Expand/Collapse - Click this icon to expand or collapse the Attack Graph panel. |
|
|
Zoom in - Click this icon to decrease the view of information within the panel. |
|
|
Zoom out - Click this icon to enlarge the information within the panel. |
|
|
Fit to View - Click this icon to recenter the graph within the panel when the panel is expanded to full screen. |
|
|
Rearrange - Click this icon to reflow the nodes and recenter the graph. |
|
|
Pan or Select - Click this icon to pan or drag an object (default), or to select or click an object. |
|
|
Layout - Changes the layout to one of the following options:
|
|
|
Group/Ungroup - Click these icons to group or ungroup the nodes on the graph based on node conditions, node count, and user selection. The nodes are grouped by default when the node count is 2 or higher. Nodes that have identical type, email related activities for senders and recipients, and nodes with no relations can be grouped. See Group Nodes for more information. |
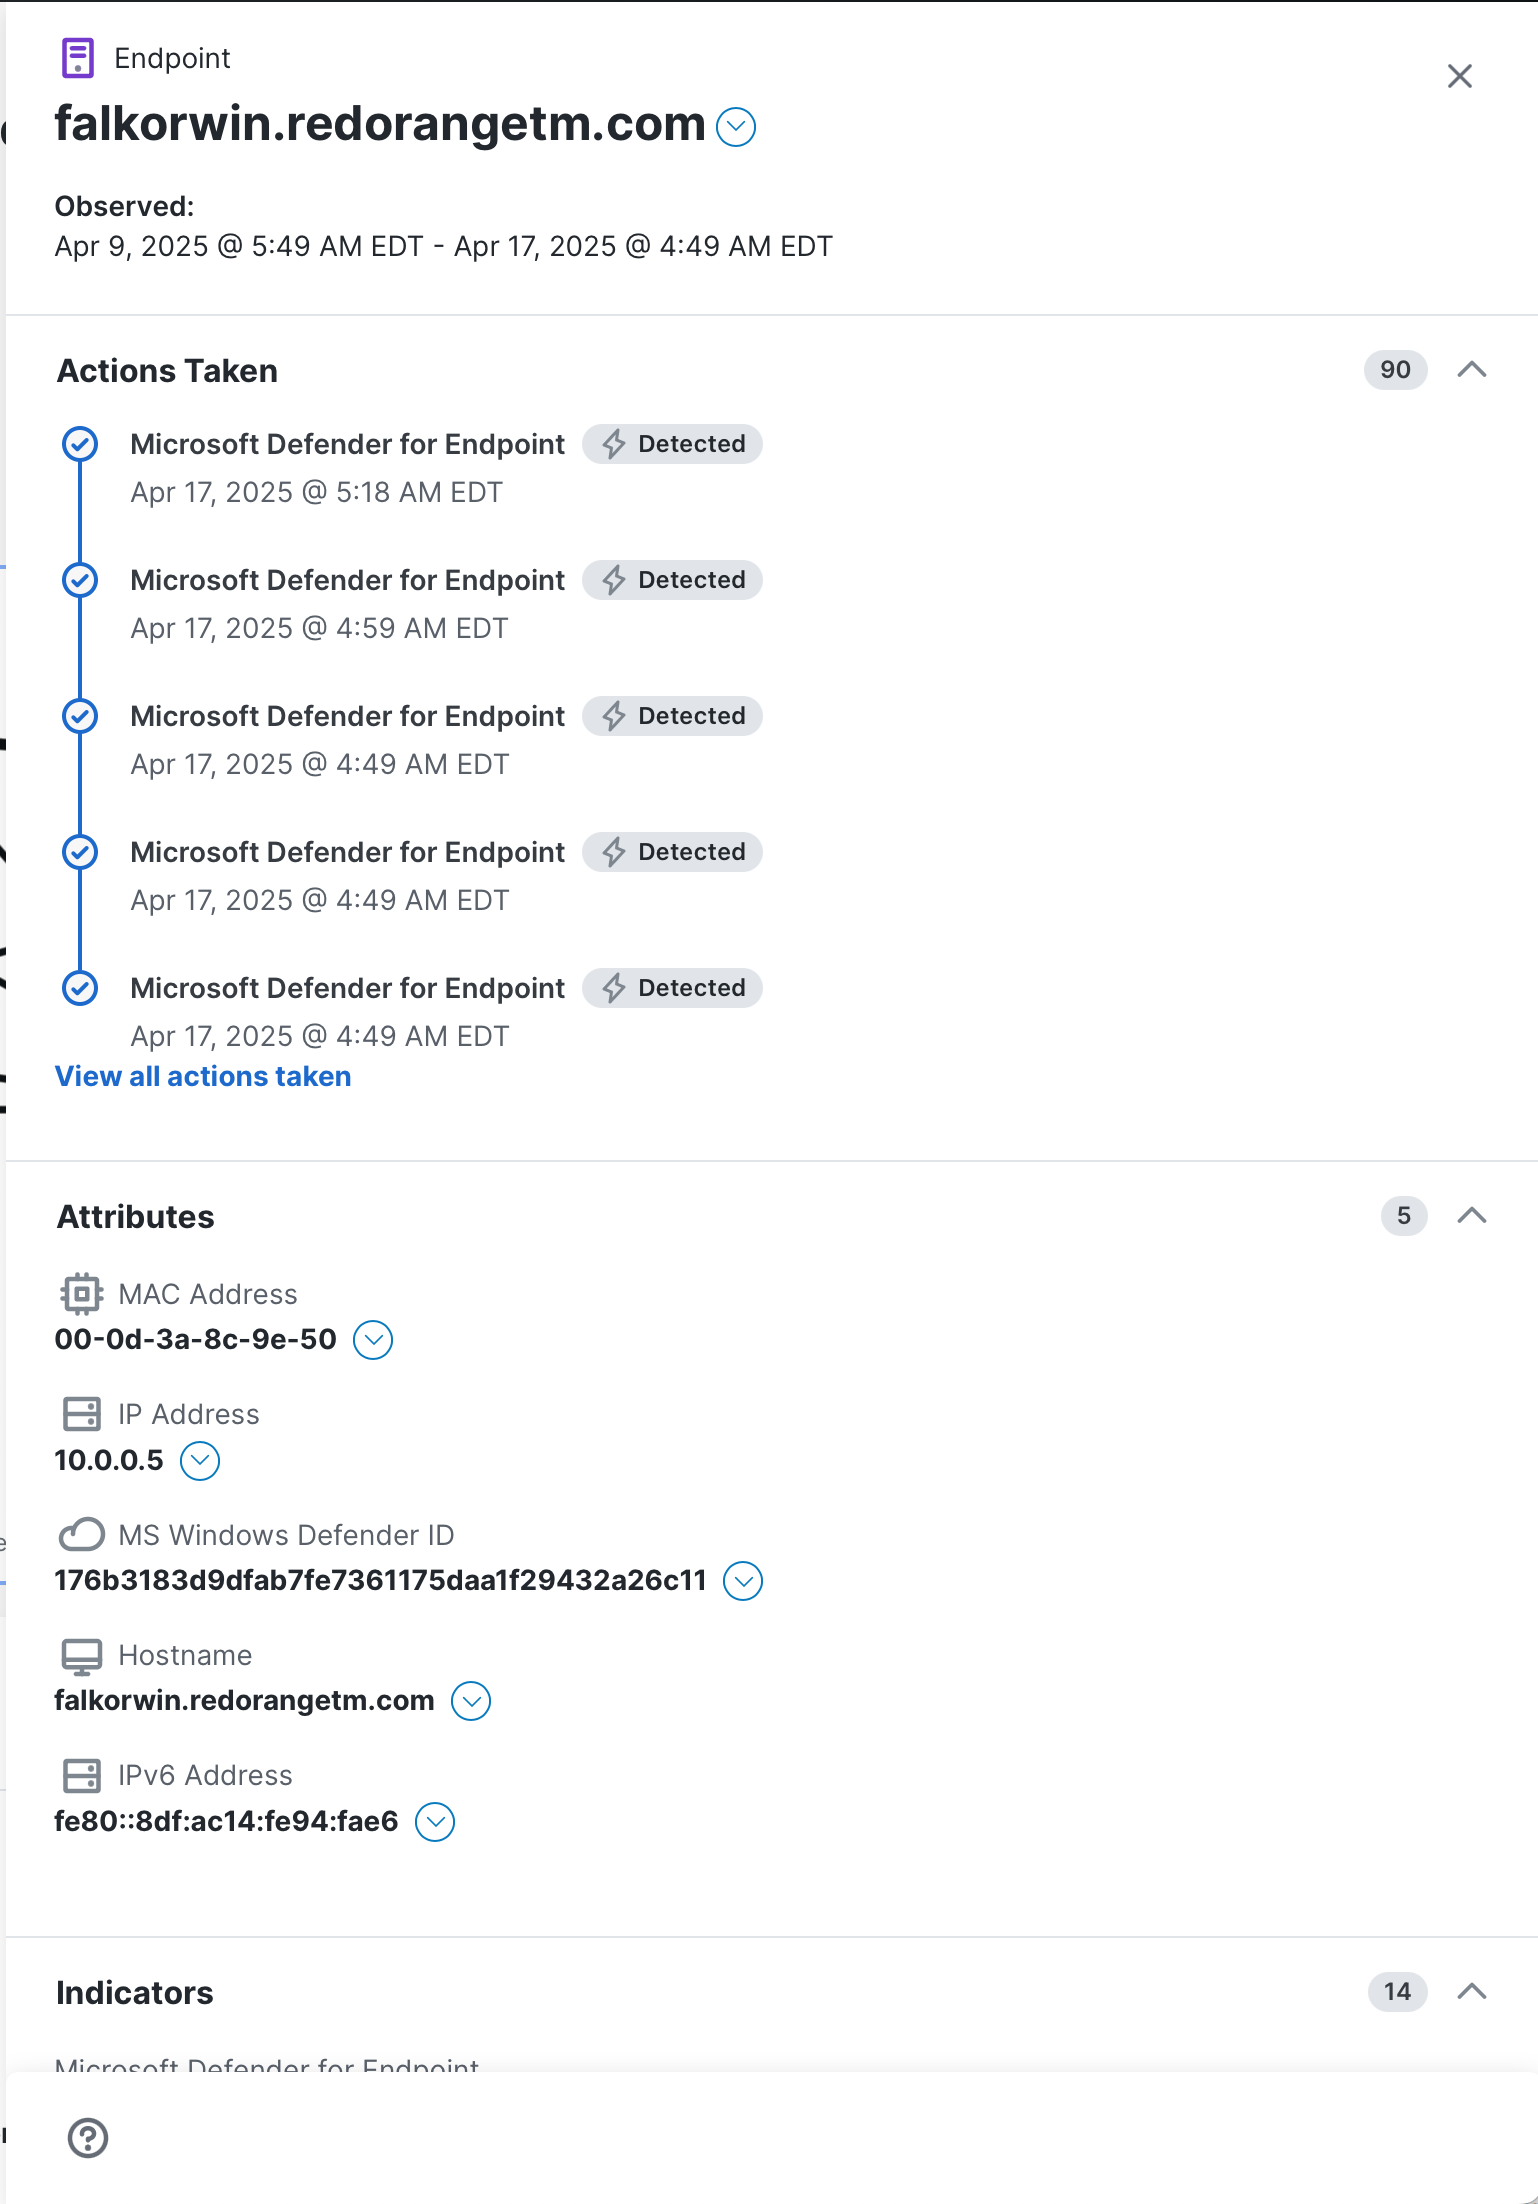
Click a single node in the Attack Graph panel to open the Node drawer and view additional details of the selected asset or observable. If the node is grouped, expand the group and click a single node.
If the device or person is in Cisco XDR Assets, then a View in Devices link or View in Users will be displayed in the upper portion of the drawer. Click the link to open and view the details in XDR Assets.
If applicable, the Actions Taken panel in the node drawer displays the remedial actions that have been executed by the integrated Endpoint Detection and Response (EDR) source and actions executed by Automation workflows for the selected node. These actions involve proactive measures, such as blocking or quarantining to manage and mitigate identified threats or security incidents, and these actions also display observable data, if available. The badges next to the source indicate the action taken and the reason for the failure, if applicable. The list of actions is sorted by latest to oldest. If there are six or more actions taken, the View all actions taken link is displayed and it opens another drawer with a complete list of all the actions taken for the node. Use the Source and Action drop-down lists in the upper portion of the Actions Taken drawer to narrow the list of all the actions taken and only show those actions that match the filters you have selected. Click the ![]() (Clear) icon to remove your selections.
(Clear) icon to remove your selections.
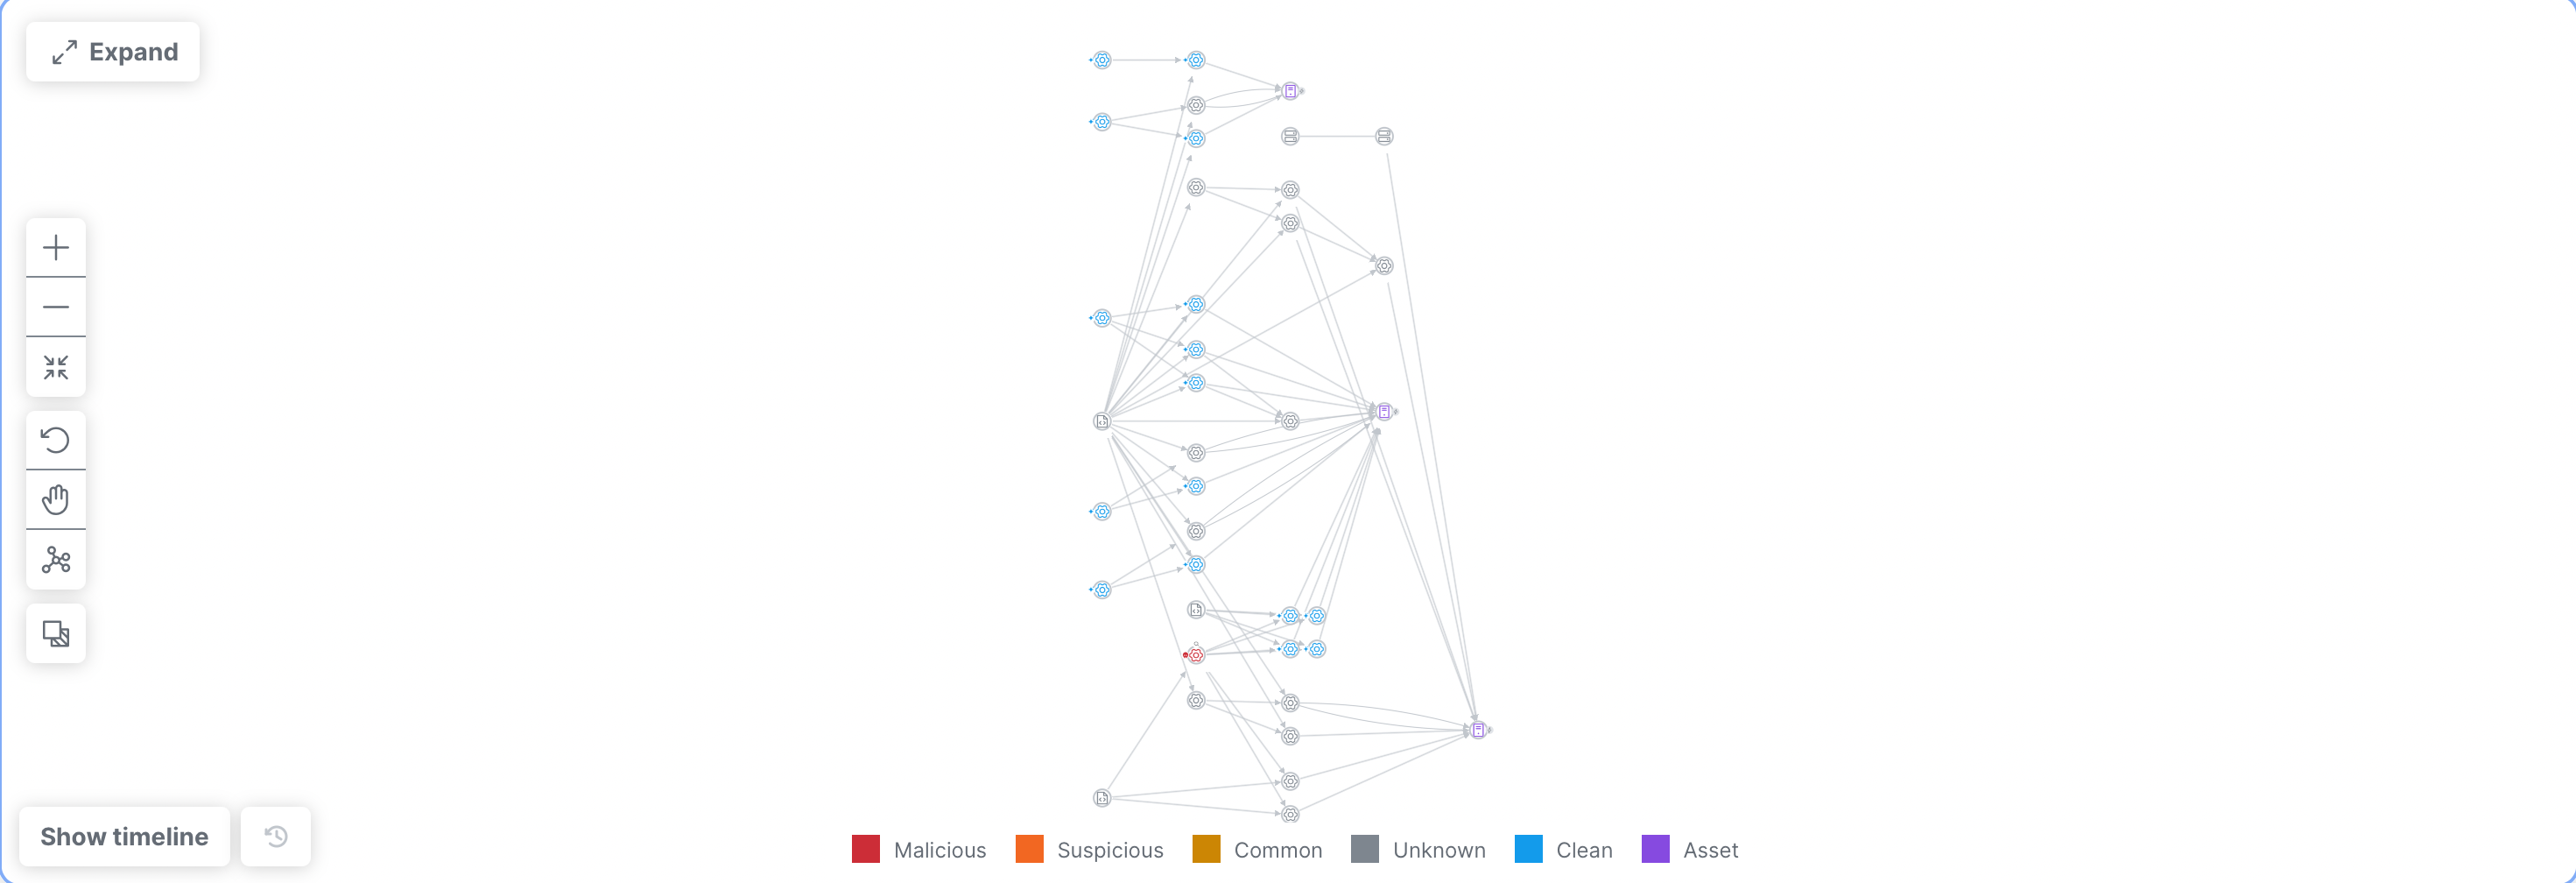
If the node count is 2 or higher and there are nodes with the same type, disposition, and have the same relationship to the same set of observables, they are grouped by default to reduce the noise on the graph. The grouping capability compresses multiple like nodes into one node on the graph.
You can also turn on or turn off the grouping capability using the ![]() (Group) icon and
(Group) icon and ![]() (Ungroup) icon i in the Graph Controls on the Attack Graph.
(Ungroup) icon i in the Graph Controls on the Attack Graph.
-
Click the
 (Group) icon to compress multiple nodes into one node.
 -
Click the
 (Ungroup) icon to show all nodes on the graph.
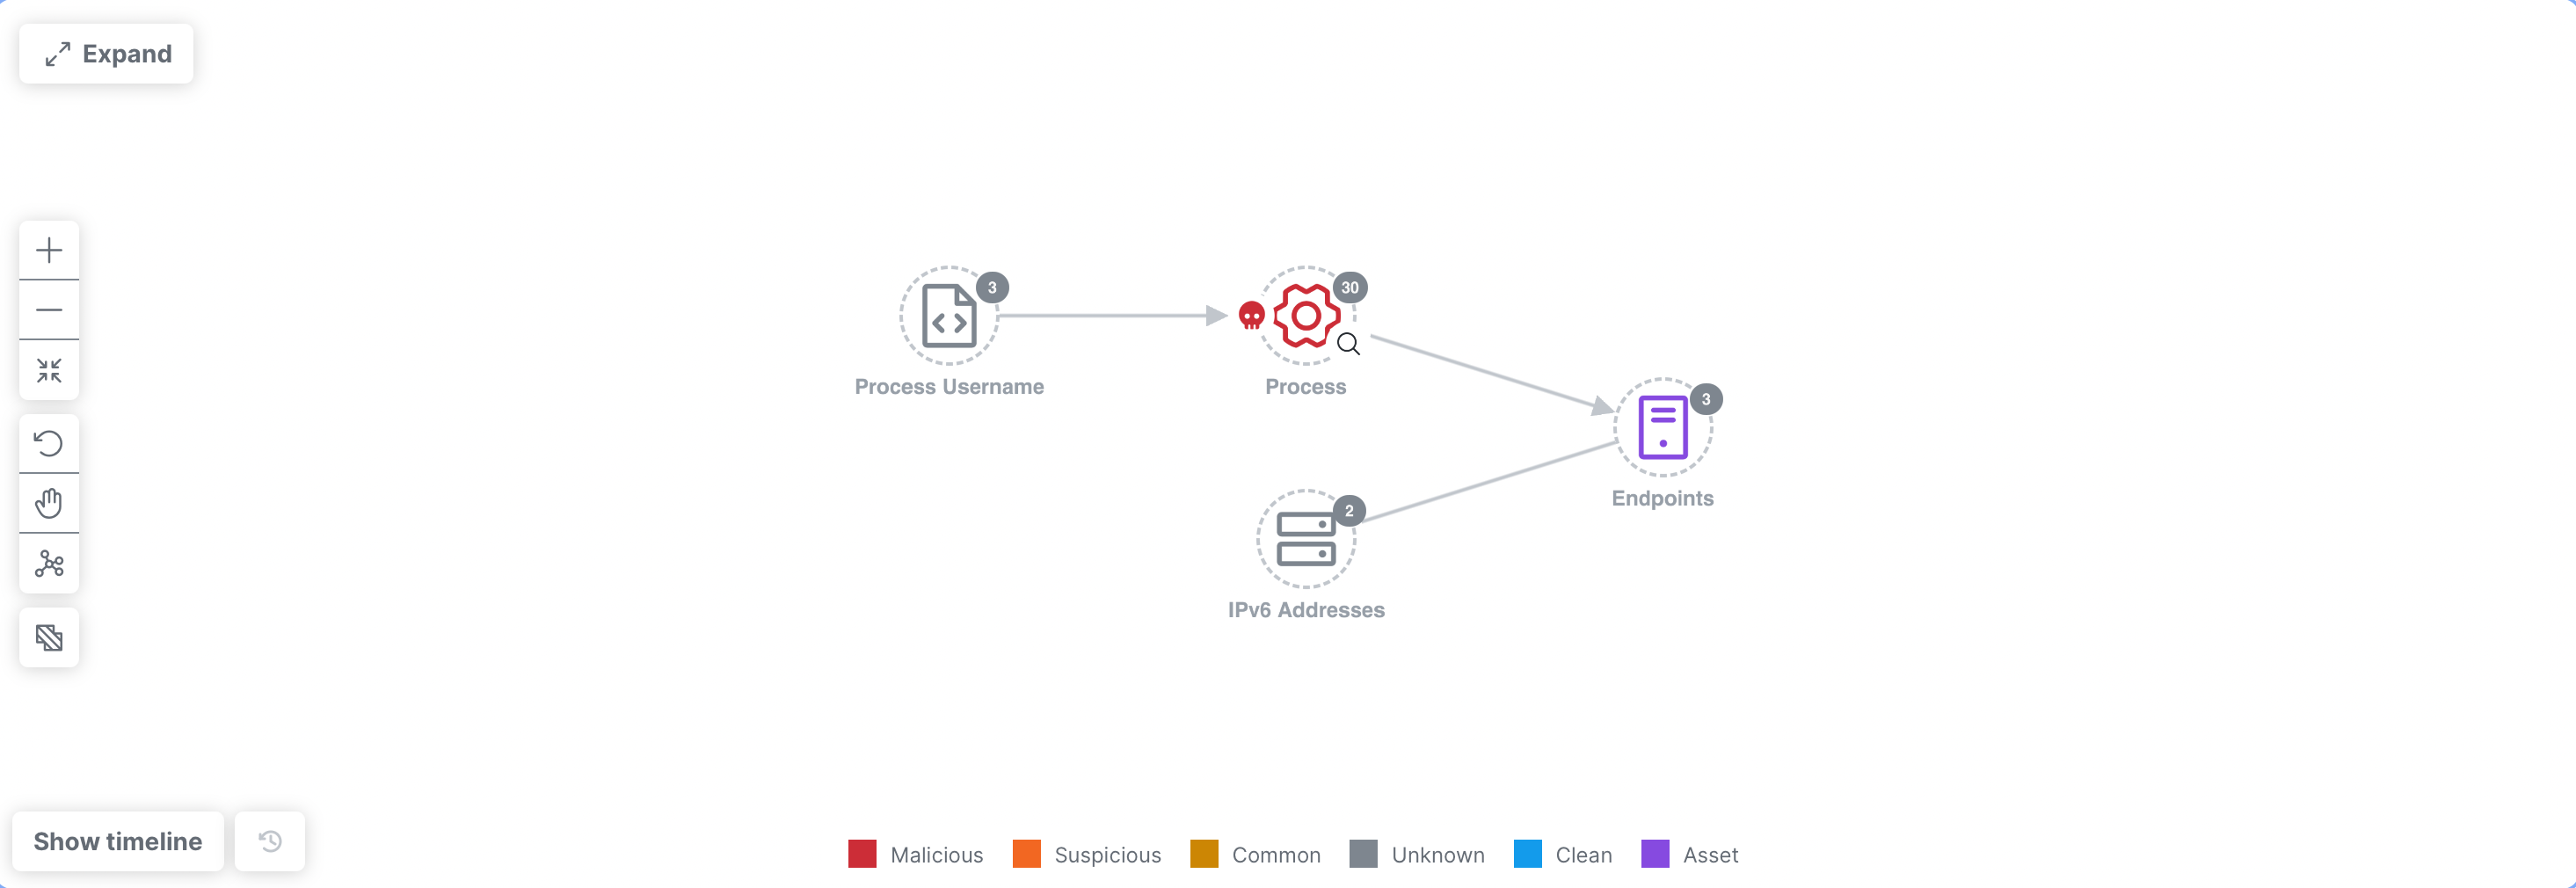
When nodes are grouped, the edge is a dotted circle, with a badge that indicates the number of nodes in the group.
In this example, these nodes were grouped because they are of the same observable type and have the same relationship (connected to) another observable.
Click the ![]() (Ungroup) icon to ungroup the nodes and return to the original view.
(Ungroup) icon to ungroup the nodes and return to the original view.
The Timeline panel beneath the Attack Graph panel displays a color-coded timeline (based on disposition) of the volume of events at different points in time. The Timeline panel is collapsed by default and you can expand the panel by clicking the Show timeline button.
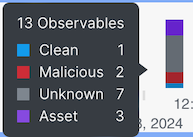
Hover any point on the timeline to open a tooltip that shows the total number of observables and assets and the disposition relevant to all events that started at that specific time.
Move the side handles on the timeline to zoom in on a specific event or zoom out. When you zoom in on the event, it also narrows the display of nodes on the graph to reflect the selection in the timeline.
To refresh the timeline, click the ![]() (Timeline Refresh) icon.
(Timeline Refresh) icon.
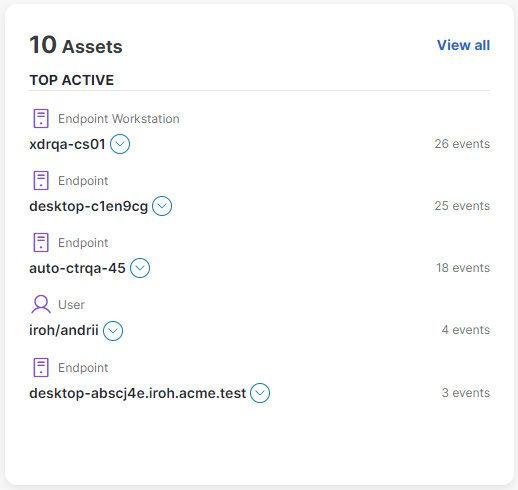
The Assets card displays the total number of unique assets from all of the events related to the selected incident and the top five unique assets with the most events. The number of events where each asset was sighted is also shown. The assets are represented by an icon that allows you to easily distinguish the asset type.
Each asset includes a ![]() (Pivot Menu) icon that enables you to take action on it. You can perform some actions directly in the Pivot menu or pivot to the integrated product to perform additional actions.
(Pivot Menu) icon that enables you to take action on it. You can perform some actions directly in the Pivot menu or pivot to the integrated product to perform additional actions.
Click View all to open the Assets drawer where you can view the full list of assets associated with the incident. Use the Search bar in the upper portion of the drawer to quickly search the list of assets.
Click the ![]() (Pivot Menu) icon to choose the attribute associated with the asset, and then choose Investigate observable to investigate it.
(Pivot Menu) icon to choose the attribute associated with the asset, and then choose Investigate observable to investigate it.
Click the (Close) icon in the upper right corner to close the drawer.
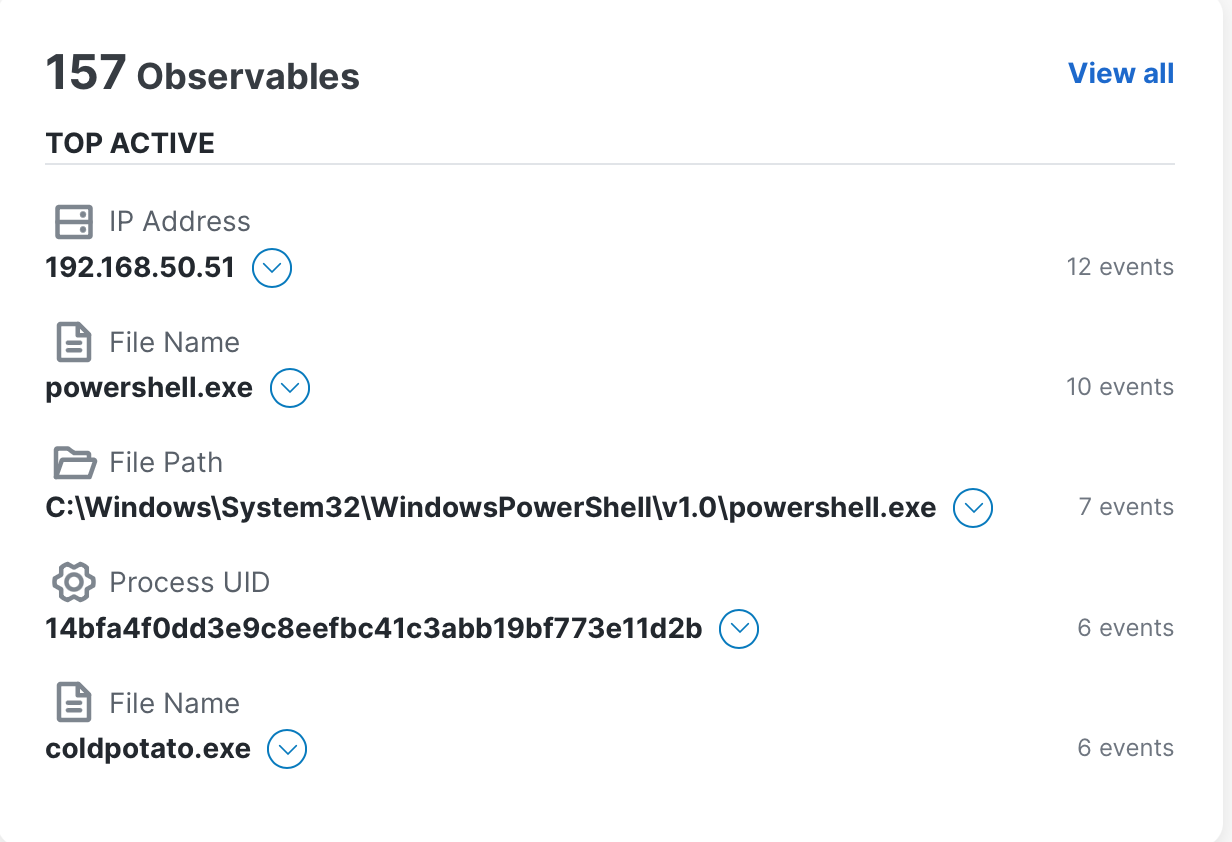
The Observables card displays the total number of unique observables from all of the events related to the incident. It includes the top five unique observables with the most events, the color-coded disposition of the observable, the event count for each observable, and the observable identifier and type. The observable is represented by a color-coded icon that allows you to easily distinguish the observable type.
Each observable includes a ![]() (Pivot Menu) icon that enables you to take action on it. You can perform some actions directly in the Pivot menu or pivot to the integrated product to perform additional actions.
(Pivot Menu) icon that enables you to take action on it. You can perform some actions directly in the Pivot menu or pivot to the integrated product to perform additional actions.
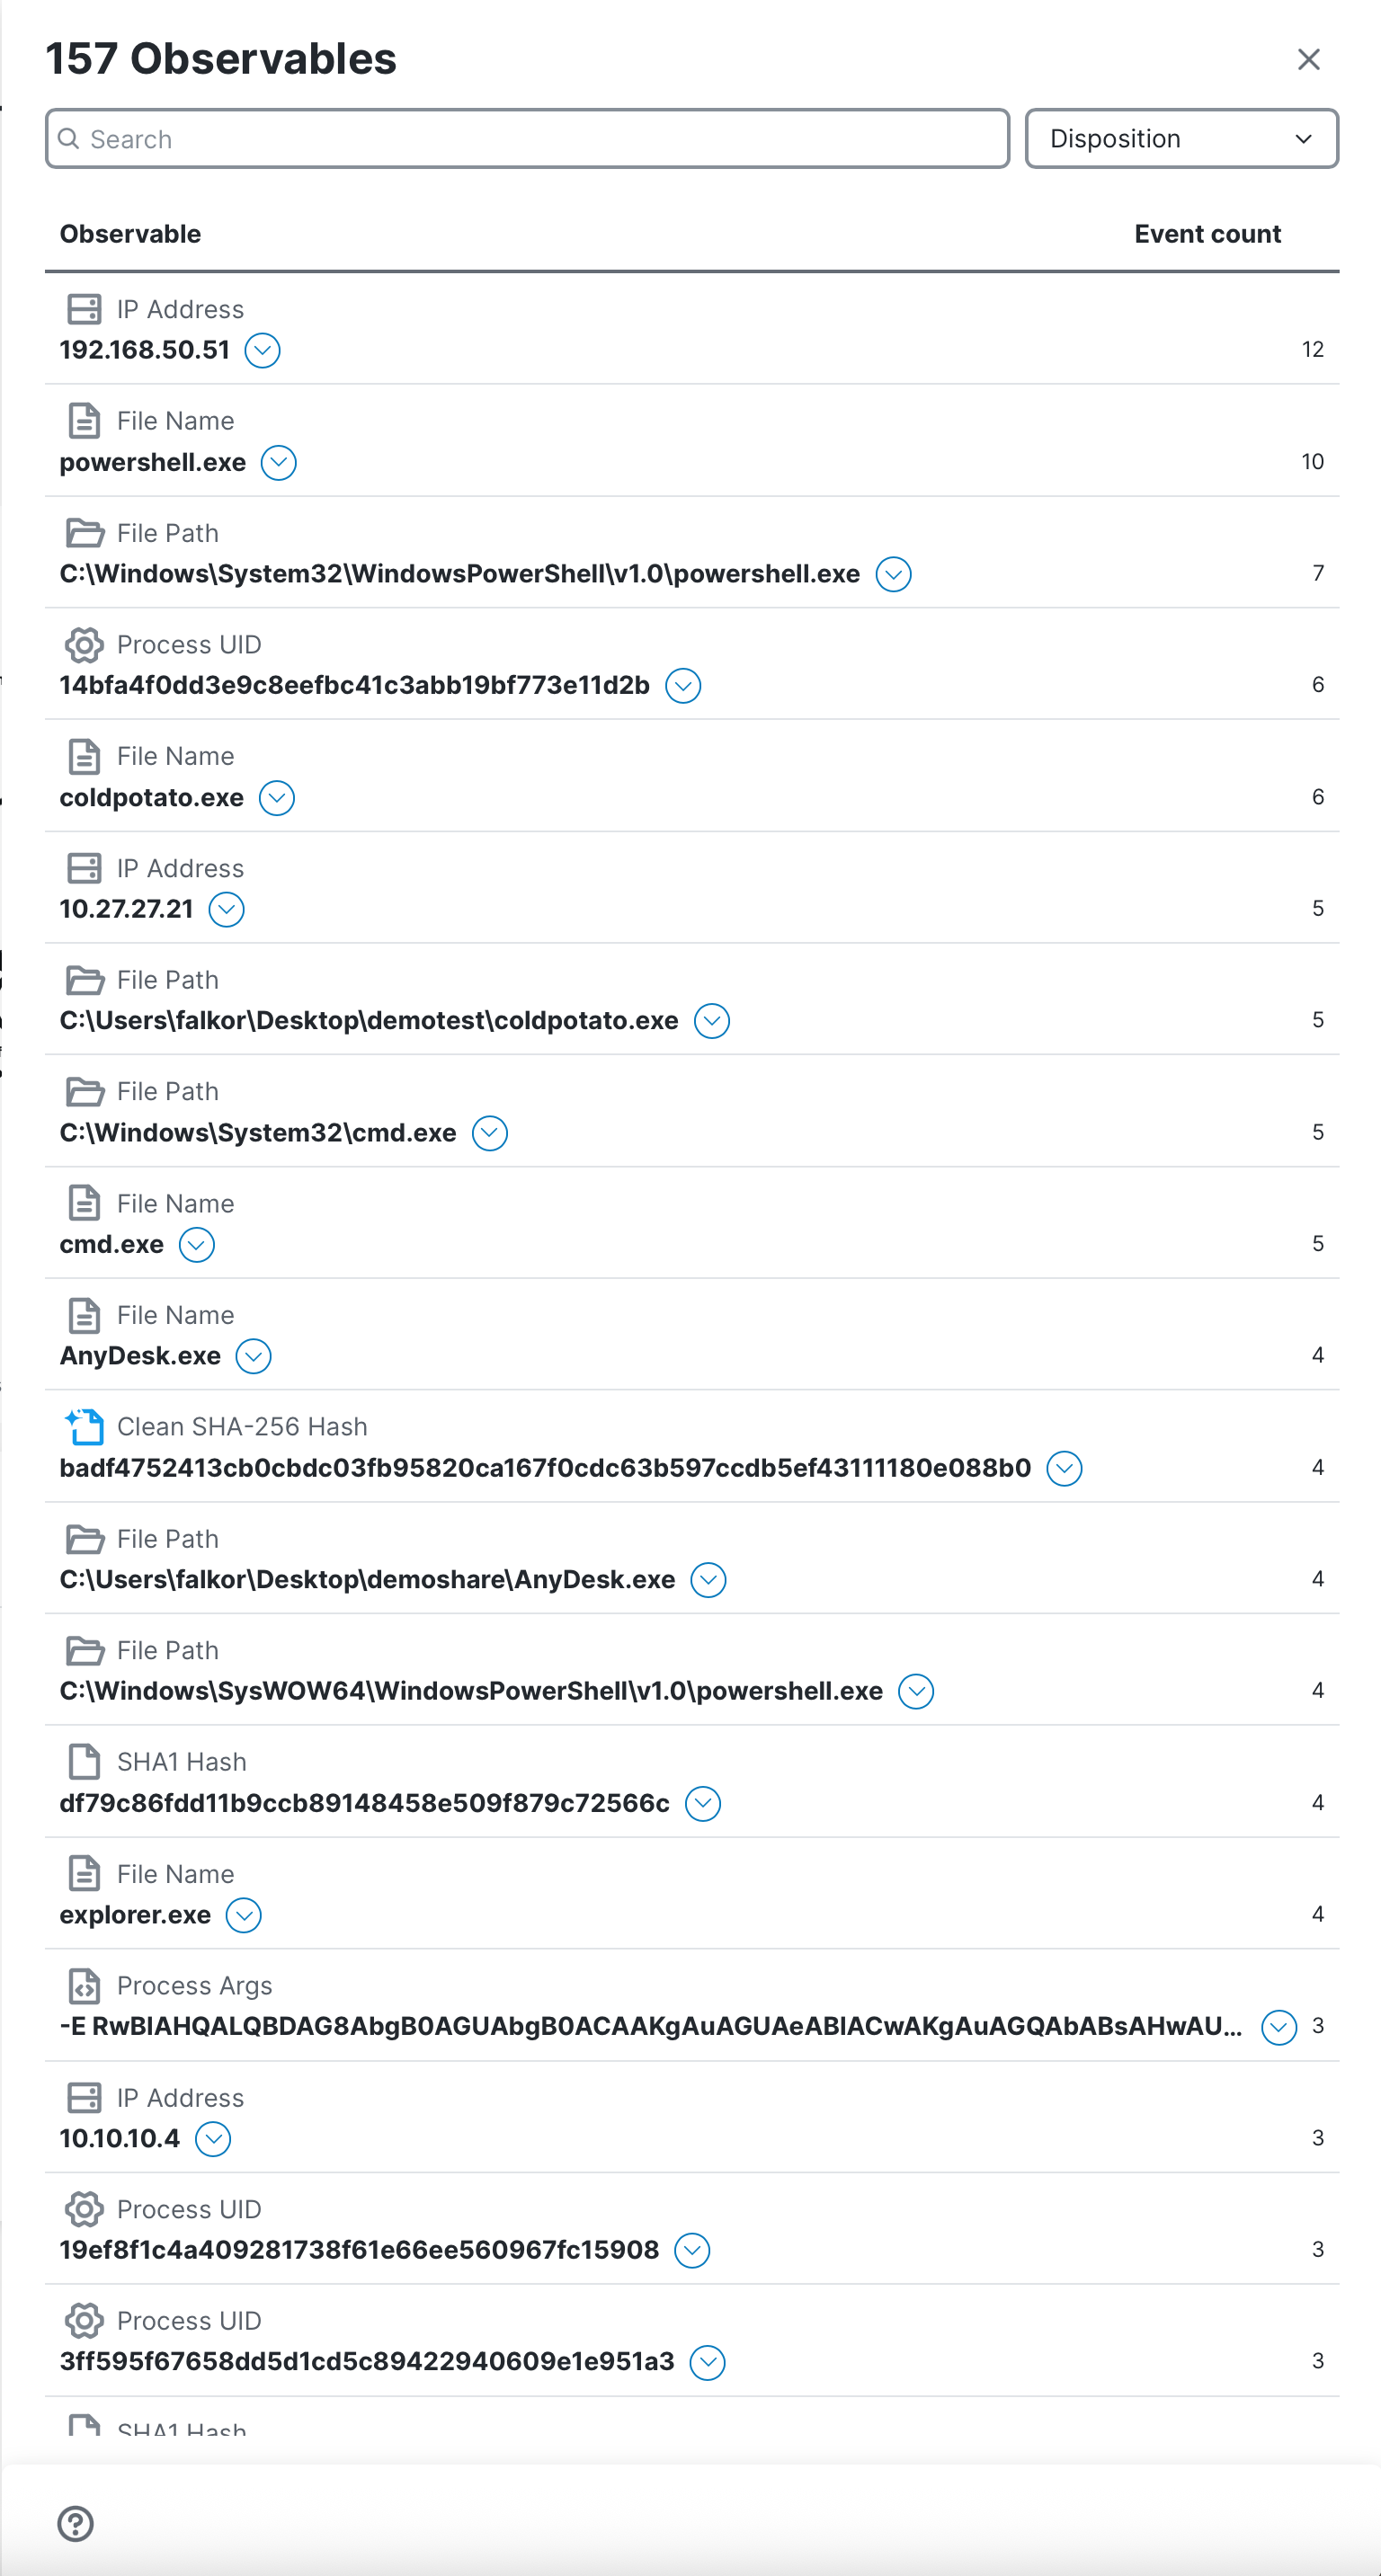
Click View all to open the Observables drawer where you can view the full list of observables associated with the incident and start a new investigation for selected incidents in a new tab.
Use the Search bar in the upper portion of the drawer to quickly search the list of observables.
From the Disposition drop-down list, check the check boxes next to the disposition values to narrow the display based on disposition. If you do not choose a disposition, all observables with all dispositions are displayed in the list. Click the ![]() (Clear) icon to remove your selections.
(Clear) icon to remove your selections.
Check the check boxes next to the observables and click Investigate observables to start a new investigation for the selected observables in a new tab. If there are more than 200 observables, you can click Select first 200 to check the check boxes next to the first 200 observables listed in the drawer. Otherwise, click Select all to check the check boxes next to all the observables.
Click the ![]() (Pivot Menu) icon to view the total number of verdicts for the observable and the source of the verdict with the highest priority disposition. Expand the section to view all the verdicts, their source, disposition, and when they were created and will expire. You can also choose Investigate observable in the Pivot menu to investigate it.
(Pivot Menu) icon to view the total number of verdicts for the observable and the source of the verdict with the highest priority disposition. Expand the section to view all the verdicts, their source, disposition, and when they were created and will expire. You can also choose Investigate observable in the Pivot menu to investigate it.
Click the (Close) icon in the upper right corner to close the drawer.
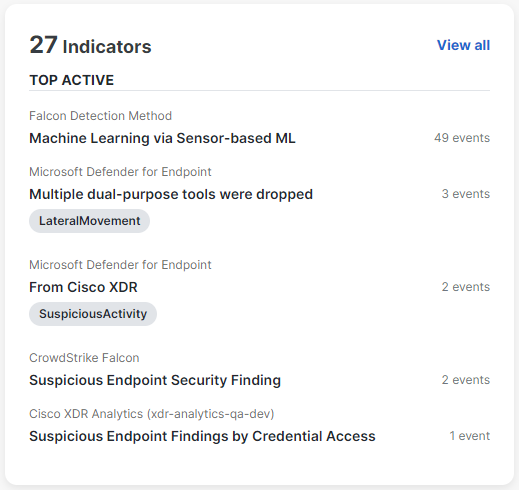
The Indicators card displays the total number of unique indicators from all events related to the incident. It includes the top five unique indicators (producer) with the most events and the event count for each indicator.
Click View all to open the Indicators drawer where you can view the full list of indicators associated with the incident, along with the number of events where the indicators were seen. Use the Search bar in the upper portion of the drawer to quickly search the list of indicators.
Click the (Close) icon in the upper right corner to close the drawer.
