Incidents App
The Cisco XDR incidents app in ribbon includes a scrollable and searchable list of incidents, the incident details, and the incident assignees. It provides the ability to triage, investigate and track high-confidence security incidents from your integrated products.
Click the ![]() or
or ![]() (Incidents App) icon on the Cisco XDR ribbon menu or the Open XDR Ribbon floating button to view incidents in the left Incidents panel and the details for the selected incident in the right Incident Details panel.
(Incidents App) icon on the Cisco XDR ribbon menu or the Open XDR Ribbon floating button to view incidents in the left Incidents panel and the details for the selected incident in the right Incident Details panel.

For more information on incidents, see Incidents.
All of the reported incidents are displayed in the left Incidents panel, along with the number of incidents in the section header. The incidents are sorted by time with the newest incident at the top of the list. The priority risk score, the source that promoted the incident to Cisco XDR, and the current status are also shown.
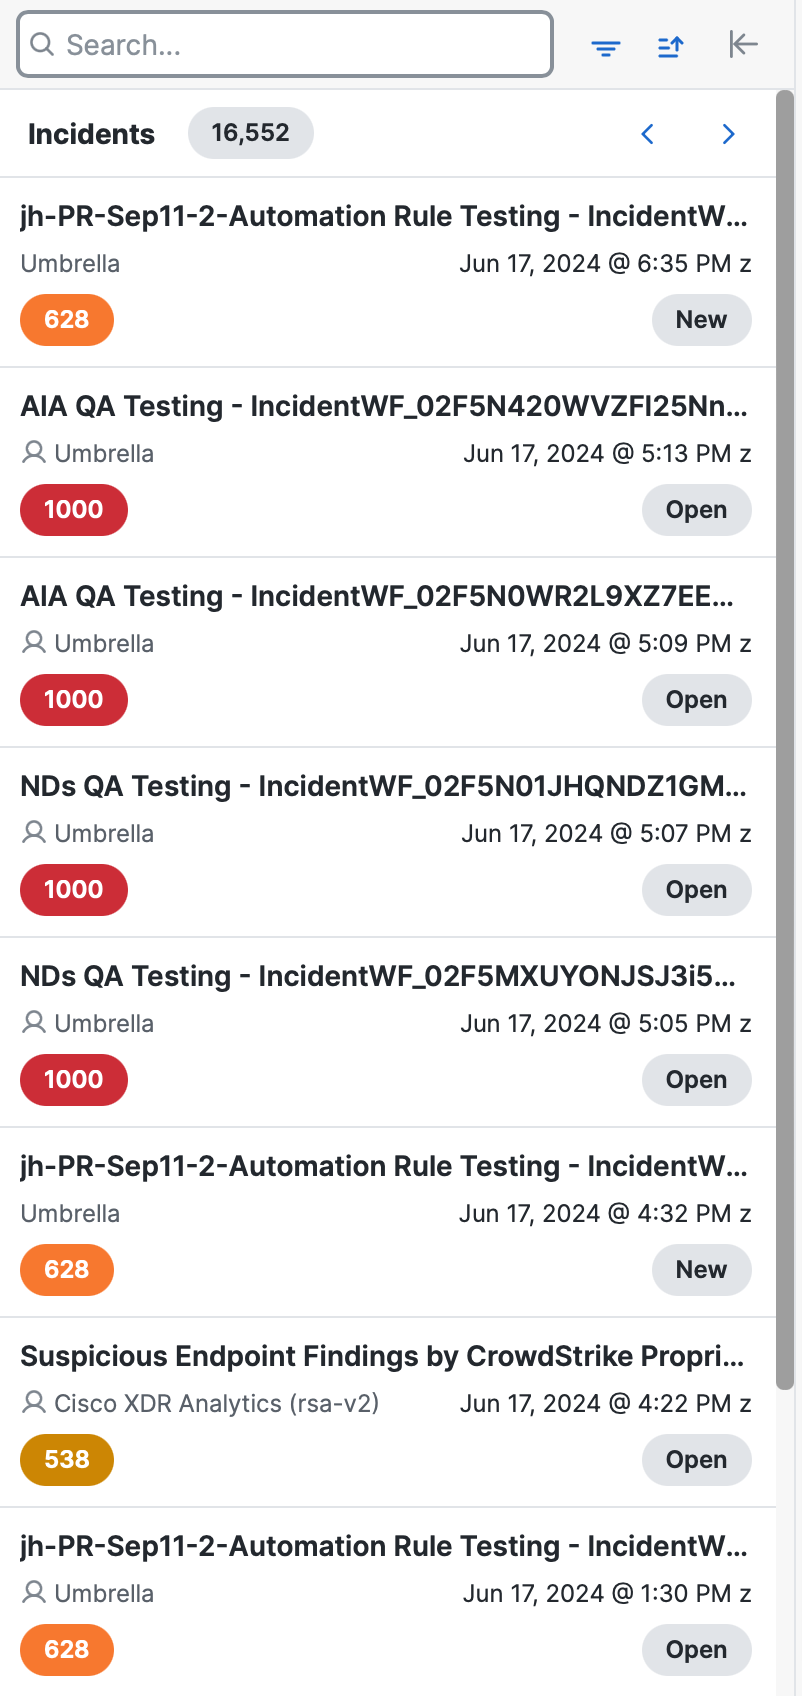
To view information about the incident, select it and view the incident details. When an incident is selected in the left Incidents panel, the description, top observables, and assignees, of the incident are displayed in the incident details on the right. You can collapse any of the panels to customize your view of the selected incident.

The AI-generated label is displayed in the Description panel if the description was generated by AI.
Note: The ![]() (Edit) icon is not available for AI generated incident title and short description.
(Edit) icon is not available for AI generated incident title and short description.
The Description panel contains a high-level description of the incident, including the source of the incident and the reason for promotion. The description varies depending on the reporting product.

Click the ![]() (Edit markdown) icon in the Description panel to open the description in a text editor, where you can make changes to it in markdown. When you have completed your edits, click the
(Edit markdown) icon in the Description panel to open the description in a text editor, where you can make changes to it in markdown. When you have completed your edits, click the ![]() (Save) icon.
(Save) icon.
The AI-generated label is displayed if the description was generated by AI.
Note: The ![]() (Edit) icon is not available for AI-generated descriptions.
(Edit) icon is not available for AI-generated descriptions.
The Incident Overview panel displays a summary of the top active assets, observables, and indicators based on the total number of events for the selected incident. For more information, see Incident Overview.
You can narrow the incidents that are displayed using the Search bar at the top of the Incidents panel. The search is triggered as you enter the search criteria. The search syntax is Lucene Query Syntax and allows for free-form text search of the incident title, short description, long description, and asset name.
Wildcards are also supported, and searches are not case-sensitive.
If you want to specify specific fields to search, such as status:New, which would limit the view to only New incidents, you must uncheck the Escape search term check box from the Filter icon.
Click ![]() (Sort) icon at the top of the Incidents panel to determine how the incidents are displayed based on date.
(Sort) icon at the top of the Incidents panel to determine how the incidents are displayed based on date.
-
In the Incidents panel, click the
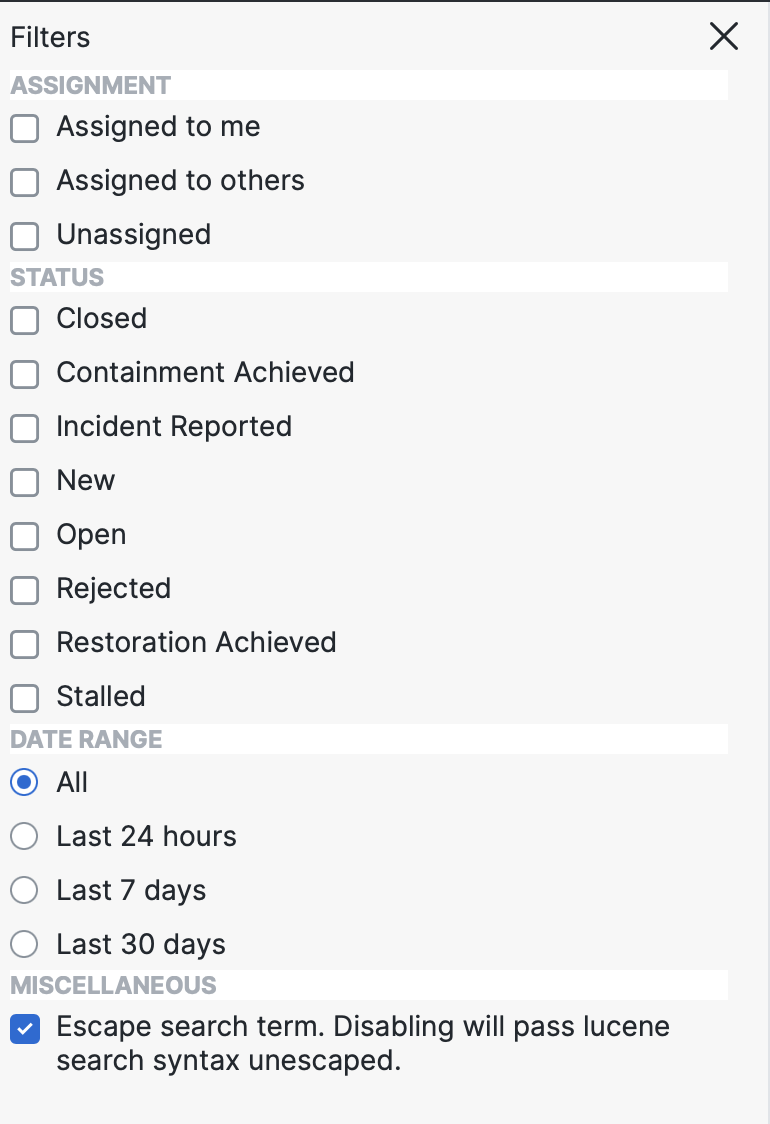
 (Filters) icon. filters to be applied to the list of incidents.
-
Check the check boxes next to the filters you want applied to the list of incidents. You can filter by the following:
-
Assignment - Check the check box next to all the incident assignments that you want to be displayed (Assigned to Me, Assigned to Others, Unassigned). Checking all or no assignment filters returns the same results.
-
Status - Check the check box next for all the statuses of incidents that you want to be displayed. If you do not check a status filter, all incident statuses will be returned.
Note: For compatibility purposes, the statuses listed in the Legacy Status area are available for filtering incidents. You cannot set an incident to one of these statuses.
-
Date Range - Select the date range for the incidents you want to be displayed (All, Last 24 hours, Last 7 days, or Last 30 days).
-
Miscellaneous - Uncheck the Escape search term check box to specify specific fields to search, such as status:“New”, which would limit the view to only New incidents.
-
-
Click Apply. The number of selected filter criteria is displayed in the header of the filtered list. Click Reset selection to clear your selections and reset the filter settings to its default values.
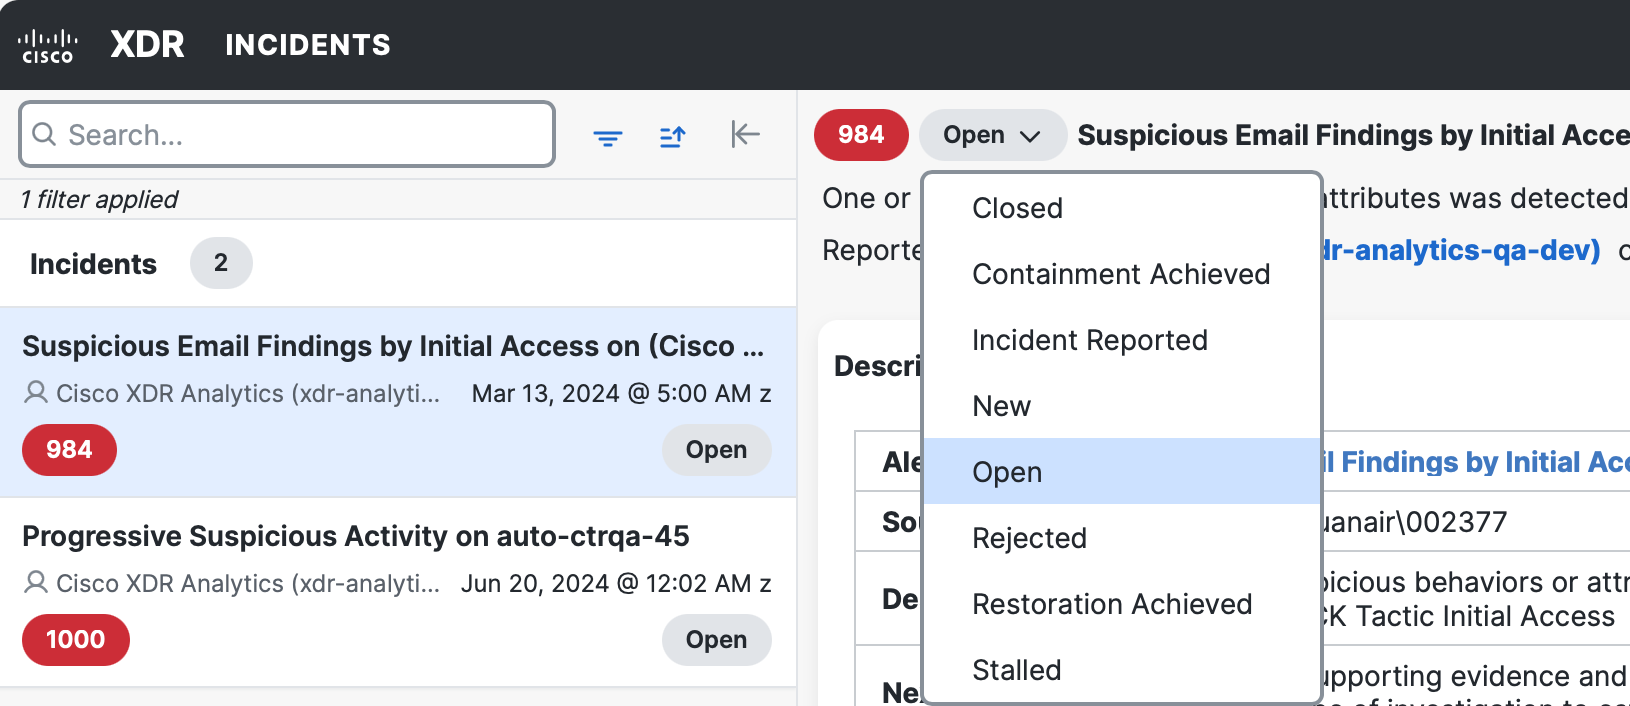
The status of the incident shows where it is in its lifecycle. All incidents start out with a New status, which indicates that they have been reported by a system but have not been confirmed. As the incidents are triaged, they can be moved to one of the Open statuses if deemed worthy of continuing an incident response process for the event. When finished, they can be marked with one of the Closed statuses. Alternatively, an event can be immediately closed if it is deemed to be inaccurate or uninteresting. For more information on incident status, see Available Statuses.
You can change the status of an incident in ribbon by clicking the drop-down menu next to the priority score in the upper left area of the Incident Details panel and choose the new status.
To associate the incident to an existing case in the casebook, click the Link drop-down list in the upper right corner of the Incident Details panel and choose Cases to link the incident to existing cases. Check the check boxes next to the existing cases to which you want to link the incident and click Link (n) Cases (the number of selected cases is displayed in the button). In the Link Case to Incident dialog box, you can:
-
Search Cases - Narrow the incidents that are displayed using the Search bar at the top of the panel. The search is triggered as you enter the search criteria. The search syntax is Lucene Query Syntax and allows for free-form text search of the incident title, short_description, and description. Wildcards are also supported, and searches are not case-sensitive.
-
Sort Cases - Click the
 (Sort) icon to sort cases by date.
 -
Filter Cases - Click the
 (Filters) icon and check or uncheck the Escape search term check box to specify specific fields to search. The number of selected filter criteria is displayed in the header of the filtered list.
 -
Select or Deselect All Cases - Click Select All to check the check boxes next to all the cases. To uncheck all the checked cases, click Deselect All.
For details on how to unlink a case from an incident, see Unlink Cases.
Click the Manage Incident link in the upper corner of the incident details to view more information about the incident on the incident details page. For more information, see Incident Detail.
You can assign users to an incident in the incident details. If the incident has not yet been assigned, the Unassigned link is displayed. When an incident is assigned, an avatar with the user's initials is displayed and you can hover over the avatar to view the user's full name in a tooltip.
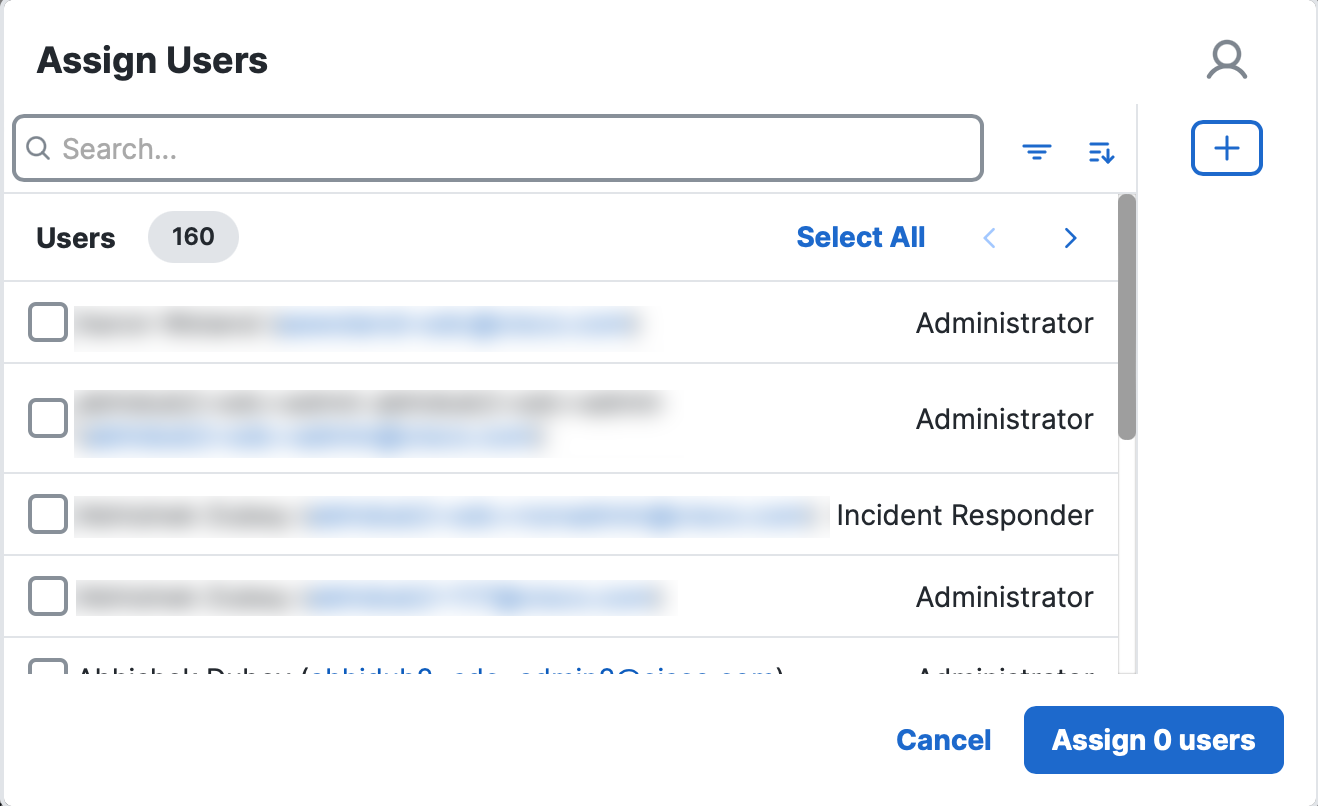
To assign users to an incident, click the Unassigned link or any of the avatars in the upper right corner of the incident details to open a popup to assign users.
By default, your user name is at the top of the list. Check the check boxes next to the users you want to assign to the current incident and click Assign. Use the Search field at the top of the popup to search for users by user name or email address to narrow the users that are displayed. The search is triggered as you enter the search criteria. Search entries are not case-sensitive.
To remove an assignee, uncheck the check box next to the name in the Users Assigned To Incident area and click Assign.
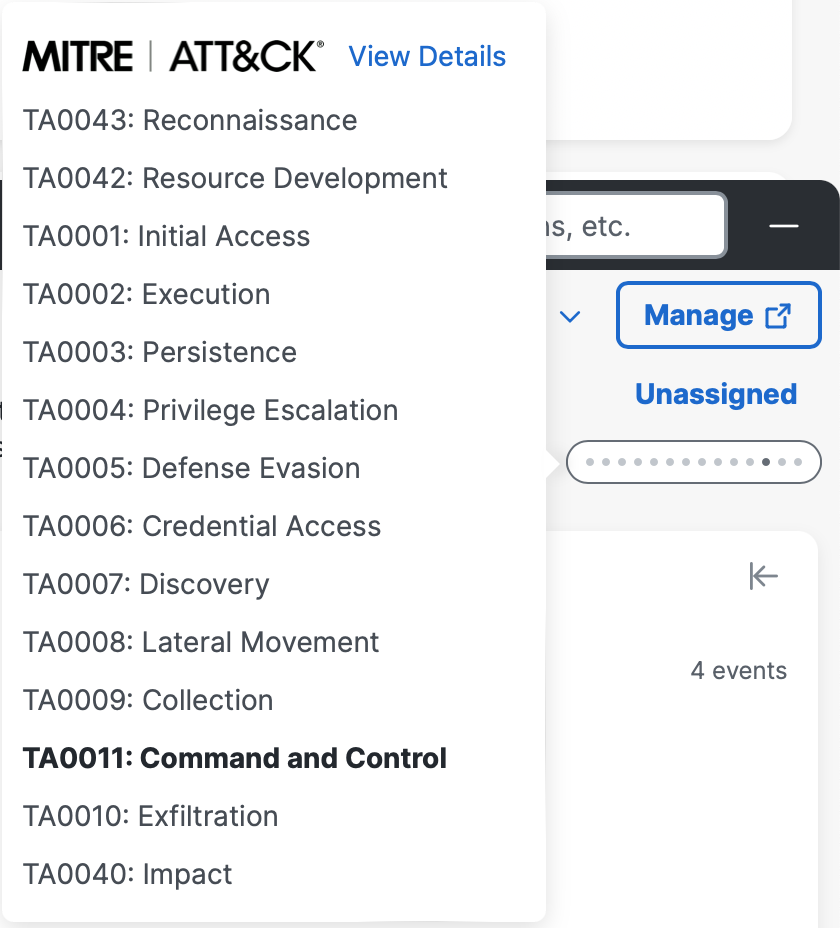
The MITRE tactic tag shows the MITRE ATT&CK® tactics impacting the incident based on the Financial Risk Score, which indicates the probability of financial impact if the MITRE ATT&CK® patterns are not mitigated — the higher the score, the higher the probability of impact. If there are two or more tactics impacting the incident, the number of tactics is also displayed in the MITRE tactic tag.
Click the MITRE tactic tag in the upper right corner of the incident details to view the MITRE Tactic popup showing a list of specific MITRE ATT&CK tactics and techniques impacting the incident. The MITRE ATT&CK Coverage Map link opens the MITRE ATT&CK Coverage Map page. For details, see MITRE ATT&CK Coverage Map.
Note: The No MITRE TTPs found tag is displayed if there are no MITRE TTP data indicated in the incident.
Click the ![]() (Expand) icon to view all the techniques for each tactic listed. Click the
(Expand) icon to view all the techniques for each tactic listed. Click the ![]() (New Tab) icon next to the tactic name to view the tactic details on the MITRE ATT&CK Enterprise Tactics page in a new tab and the technique link displays the technique details on the MITRE ATT&CK Enterprise Techniques page in a new tab.
(New Tab) icon next to the tactic name to view the tactic details on the MITRE ATT&CK Enterprise Tactics page in a new tab and the technique link displays the technique details on the MITRE ATT&CK Enterprise Techniques page in a new tab.
Click View events to view all events related to the incident on the Detections page in the incident detail. For details, see Detection.

