Investigation Results
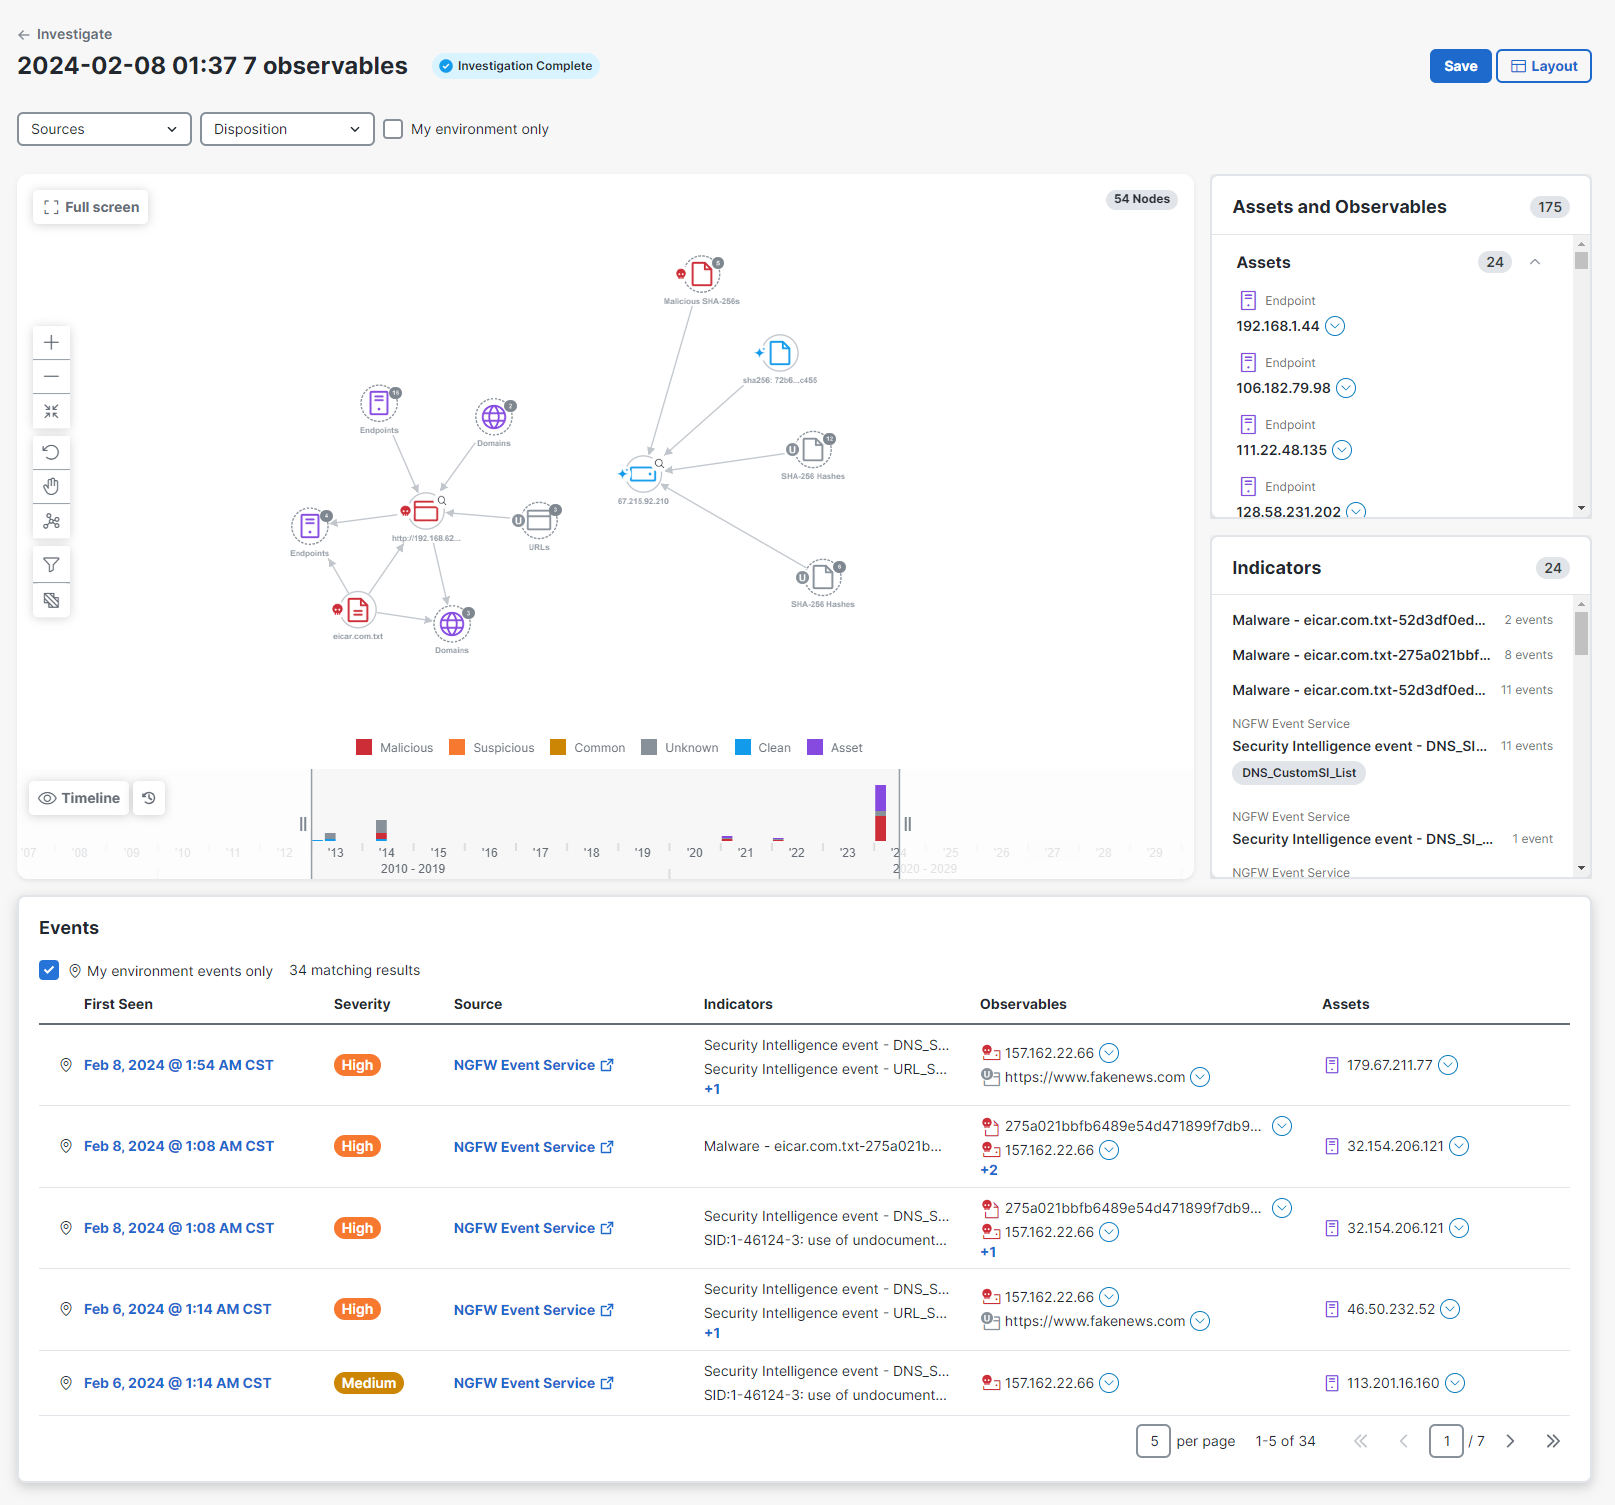
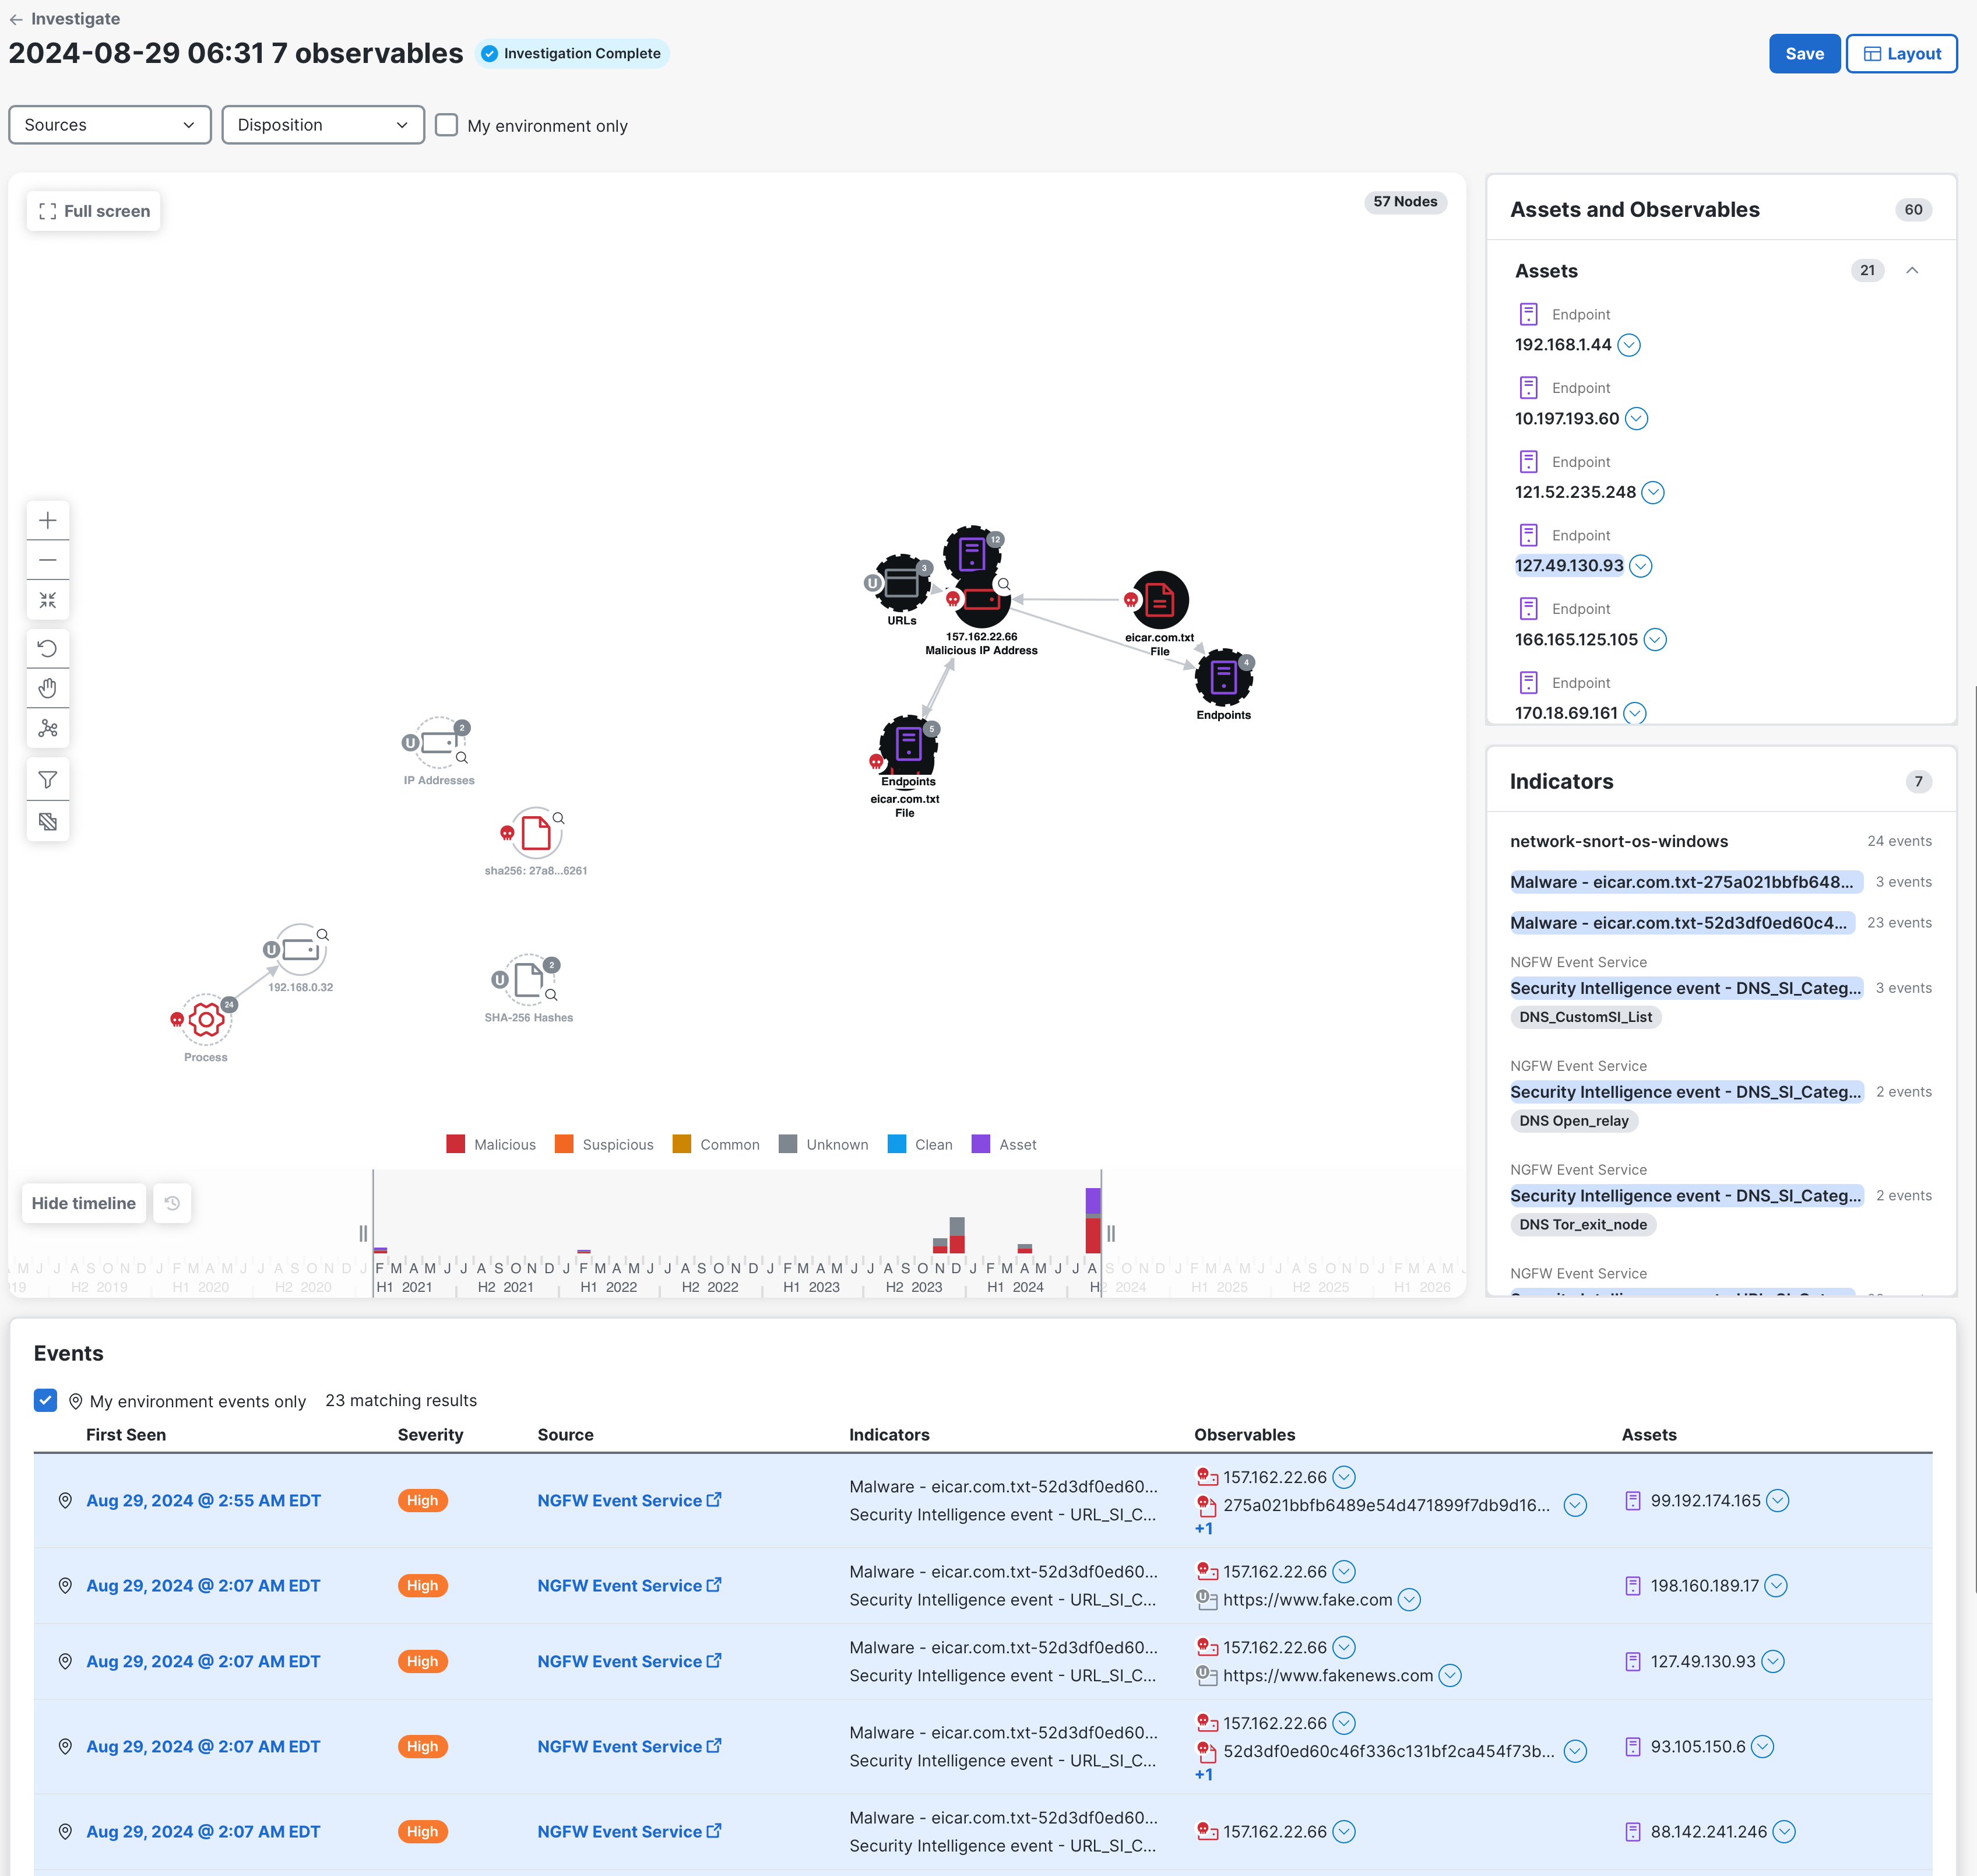
After the investigation has completed, the investigation results are displayed on the Investigation Results page, which shows the investigation in the Relations Graph panel and the volume of events in the Timeline panel. Additional details for the events are displayed in the Events, Assets and Observables, and Indicators panels.
An error and/or warning badge is displayed beside the investigation title if an error and/or warning occurred during a new investigation. Click the badge to view a detailed list of the errors or warnings. Once the investigation is saved, the error and/or warning badge changes to Historical errors and you can click the badge for a list of errors and/or warnings that occurred at the time of the investigation.
The Investigation Results page shows data from all sources and with all dispositions by default. You can filter the data using the Sources and Disposition filters to narrow the display to show only the data from specific sources and with specific dispositions. These filters apply to every panel on the Investigation Results page.
You can also filter to show data from only your environment in the Relations Graph panel, Assets and Observables panel, and Indicators panel and exclude all other data outside your environment using the My environment only check box.
When filtering data by source, only the data from the selected sources are shown the Relations Graph panel, Assets and Observables panel, Indicators panel, and Events table. All other data is hidden.
To filter data by source, click the Sources drop-down list and check the check box for the source of data you want to see; all other data is hidden. The number of selected filters is displayed on the Sources filter.
To clear your selections, click the ![]() (Clear) icon.
(Clear) icon.
When filtering data by disposition, only the data returned with the selected disposition is shown on the Relations Graph panel, Assets and Observables panel, Indicators panel, and Events table.
To filter data by disposition, click the Disposition drop-down and check the check box for the dispositions you want to see; all other dispositions are hidden. The number of filters is displayed on the Disposition filter.
To clear your selections, click the ![]() (Clear) icon.
(Clear) icon.
By default, all investigation data (internal and external to your environment) is shown on the Relations Graph, Assets and Observables, and Indicators panels. By default, the Events table shows only events from your environment.
You can filter the overall investigation to show data that is only internal to your environment by checking the My environment only check box in the upper portion of the Investigation Results page.
When this check box is checked, all data on the Investigation Results page that is outside of your environment is excluded. The Events table is forced to display only events from your environment and the My environment events only check box for the Events table is disabled.
On the Events table, the My environment events only check box is enabled and checked by default to show only events in your environment (if the My environment only page filter is unchecked). The ![]() (Internal Event) icon in the Events table indicates that only events in your environment are being displayed.
(Internal Event) icon in the Events table indicates that only events in your environment are being displayed.
If you want to show all events from the investigation in the Events table, uncheck the My environment events only check box.
You can choose how you want the panels on the Investigation Results page to be displayed using the Layout button in the upper right corner of the page.
Click Layout and choose one of the following layouts:
- Graph up - The Relations Graph panel is displayed in the upper portion of the page and the Events table, Assets and Observables panel, and Indicators panel are displayed side by side in the lower portion of the page.
-
Graph up split - The Relations Graph panel, Assets and Observables panel, and Indicators panel are displayed side by side in the upper portion of the page and the Events table is displayed in the lower portion of the page.
-
Graph down - The Relations Graph panel is displayed in the lower portion of the page and the Events table, Assets and Observables panel, and Indicators panel are displayed side by side in the upper portion of the page.
-
Graph down split - The Relations Graph panel, Assets and Observables panel, and Indicators panel are displayed side by side in lower portion of the page and the Events table is displayed in the upper portion of the page.
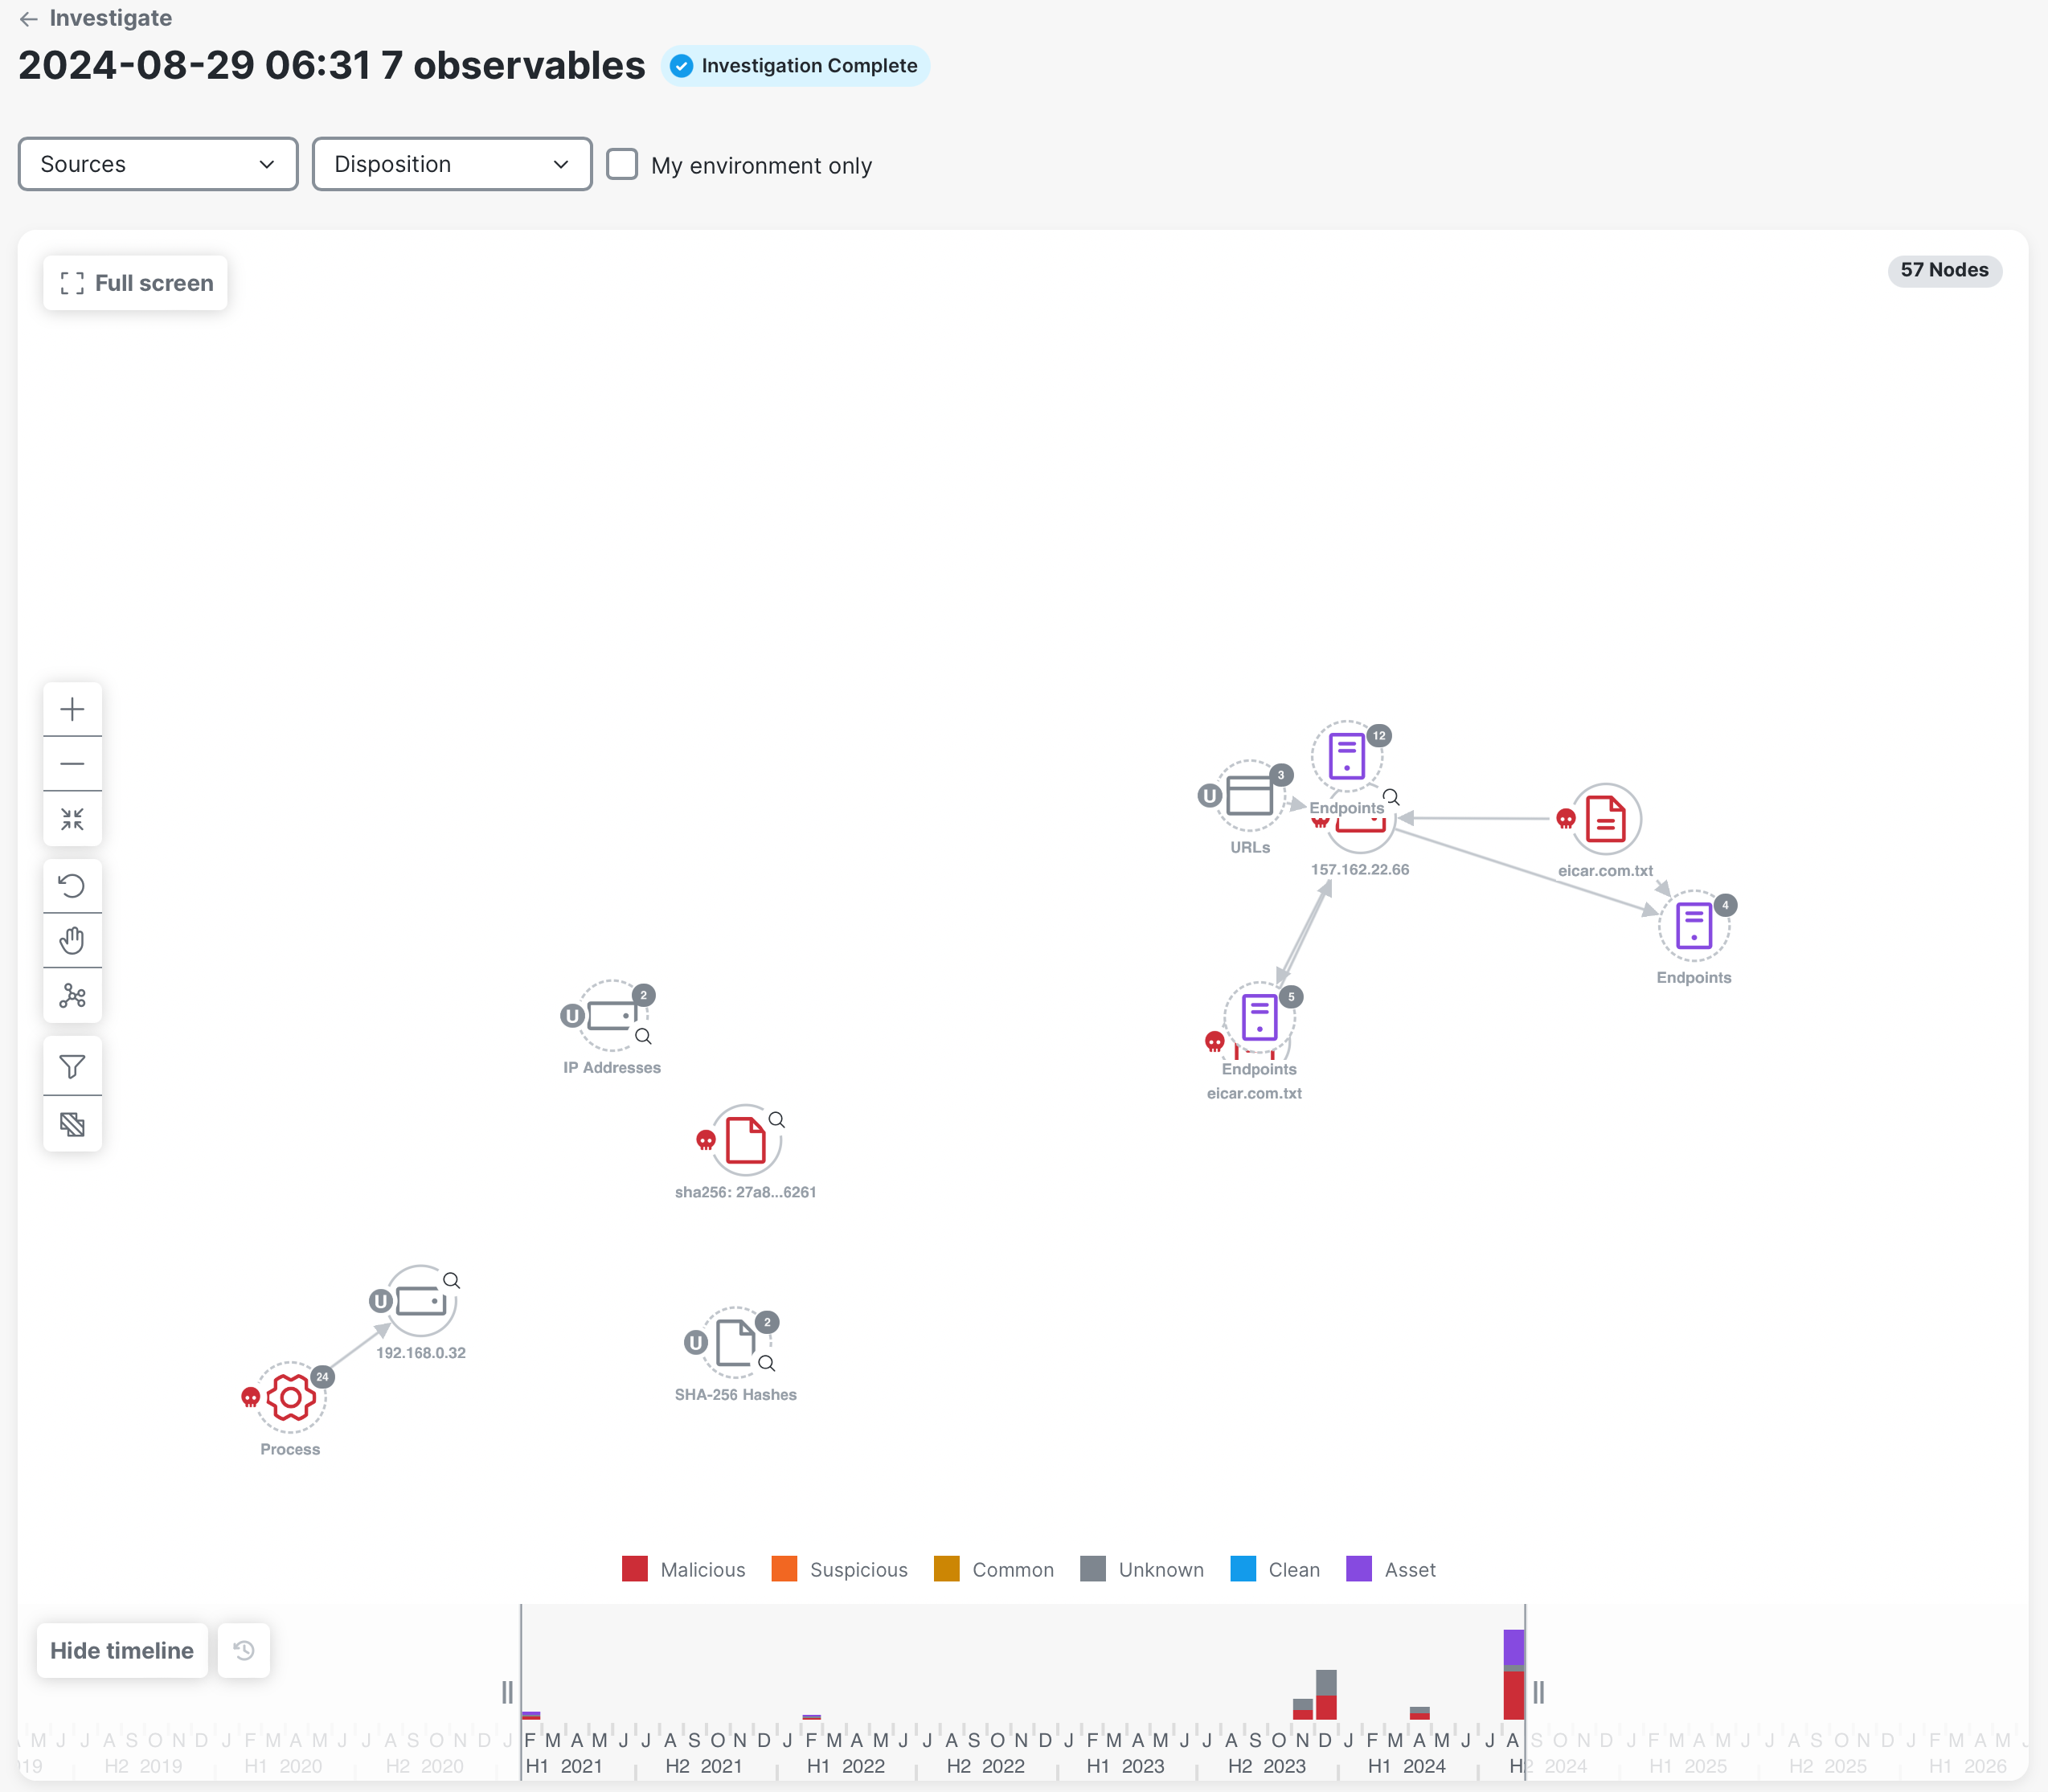
The Relations Graph panel shows a force-directed graph of how the observables in the investigation are connected.
While the investigation is running, a progress bar displays above the Relations Graph panel. Once the investigation has completed, the progress bar shows a status of Complete and a green check mark. The total number of nodes in the investigation is displayed in the upper right corner of the panel.
Use the Graph Controls in the upper portion of the graph to change the layout and view, and to filter the nodes that are displayed:
| Icon | Description |
|---|---|
|
|
Full screen/Exit full screen - Located in the upper left corner of the panel; click these icons to expand the panel to full screen or collapse the panel to the default view. |
|
|
Zoom in - Click this icon to decrease the view of information within the panel. |
|
|
Zoom out - Click this icon to enlarge the information within the panel. |
|
|
Fit to view - Click this icon to recenter the graph within the panel when the panel is expanded to full screen. |
|
|
Rearrange - Click this icon to reflow the nodes and recenter the graph. |
|
|
Pan or Select - Pan is set by default to drag an object; click the icon to switch it to Select mode where you can click an object. |
|
|
Layout - Changes the layout to one of the following options:
|
|
|
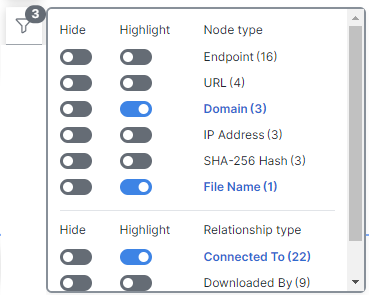
Filter - Choose the Node type and Relationship type to narrow the display and reduce the noise in the graph. Click the Hide or Highlight toggle for the nodes or relationships you want to filter. The number of selected filters is displayed as a badge on the |
|
|
Group/Ungroup - Click these icons to group or ungroup the nodes on the graph based on node conditions, node count, and user selection. The nodes are grouped by default when the node count is 20 or higher. Nodes that have identical type and disposition and relationship structure can be grouped. See Group Nodes for more information. |
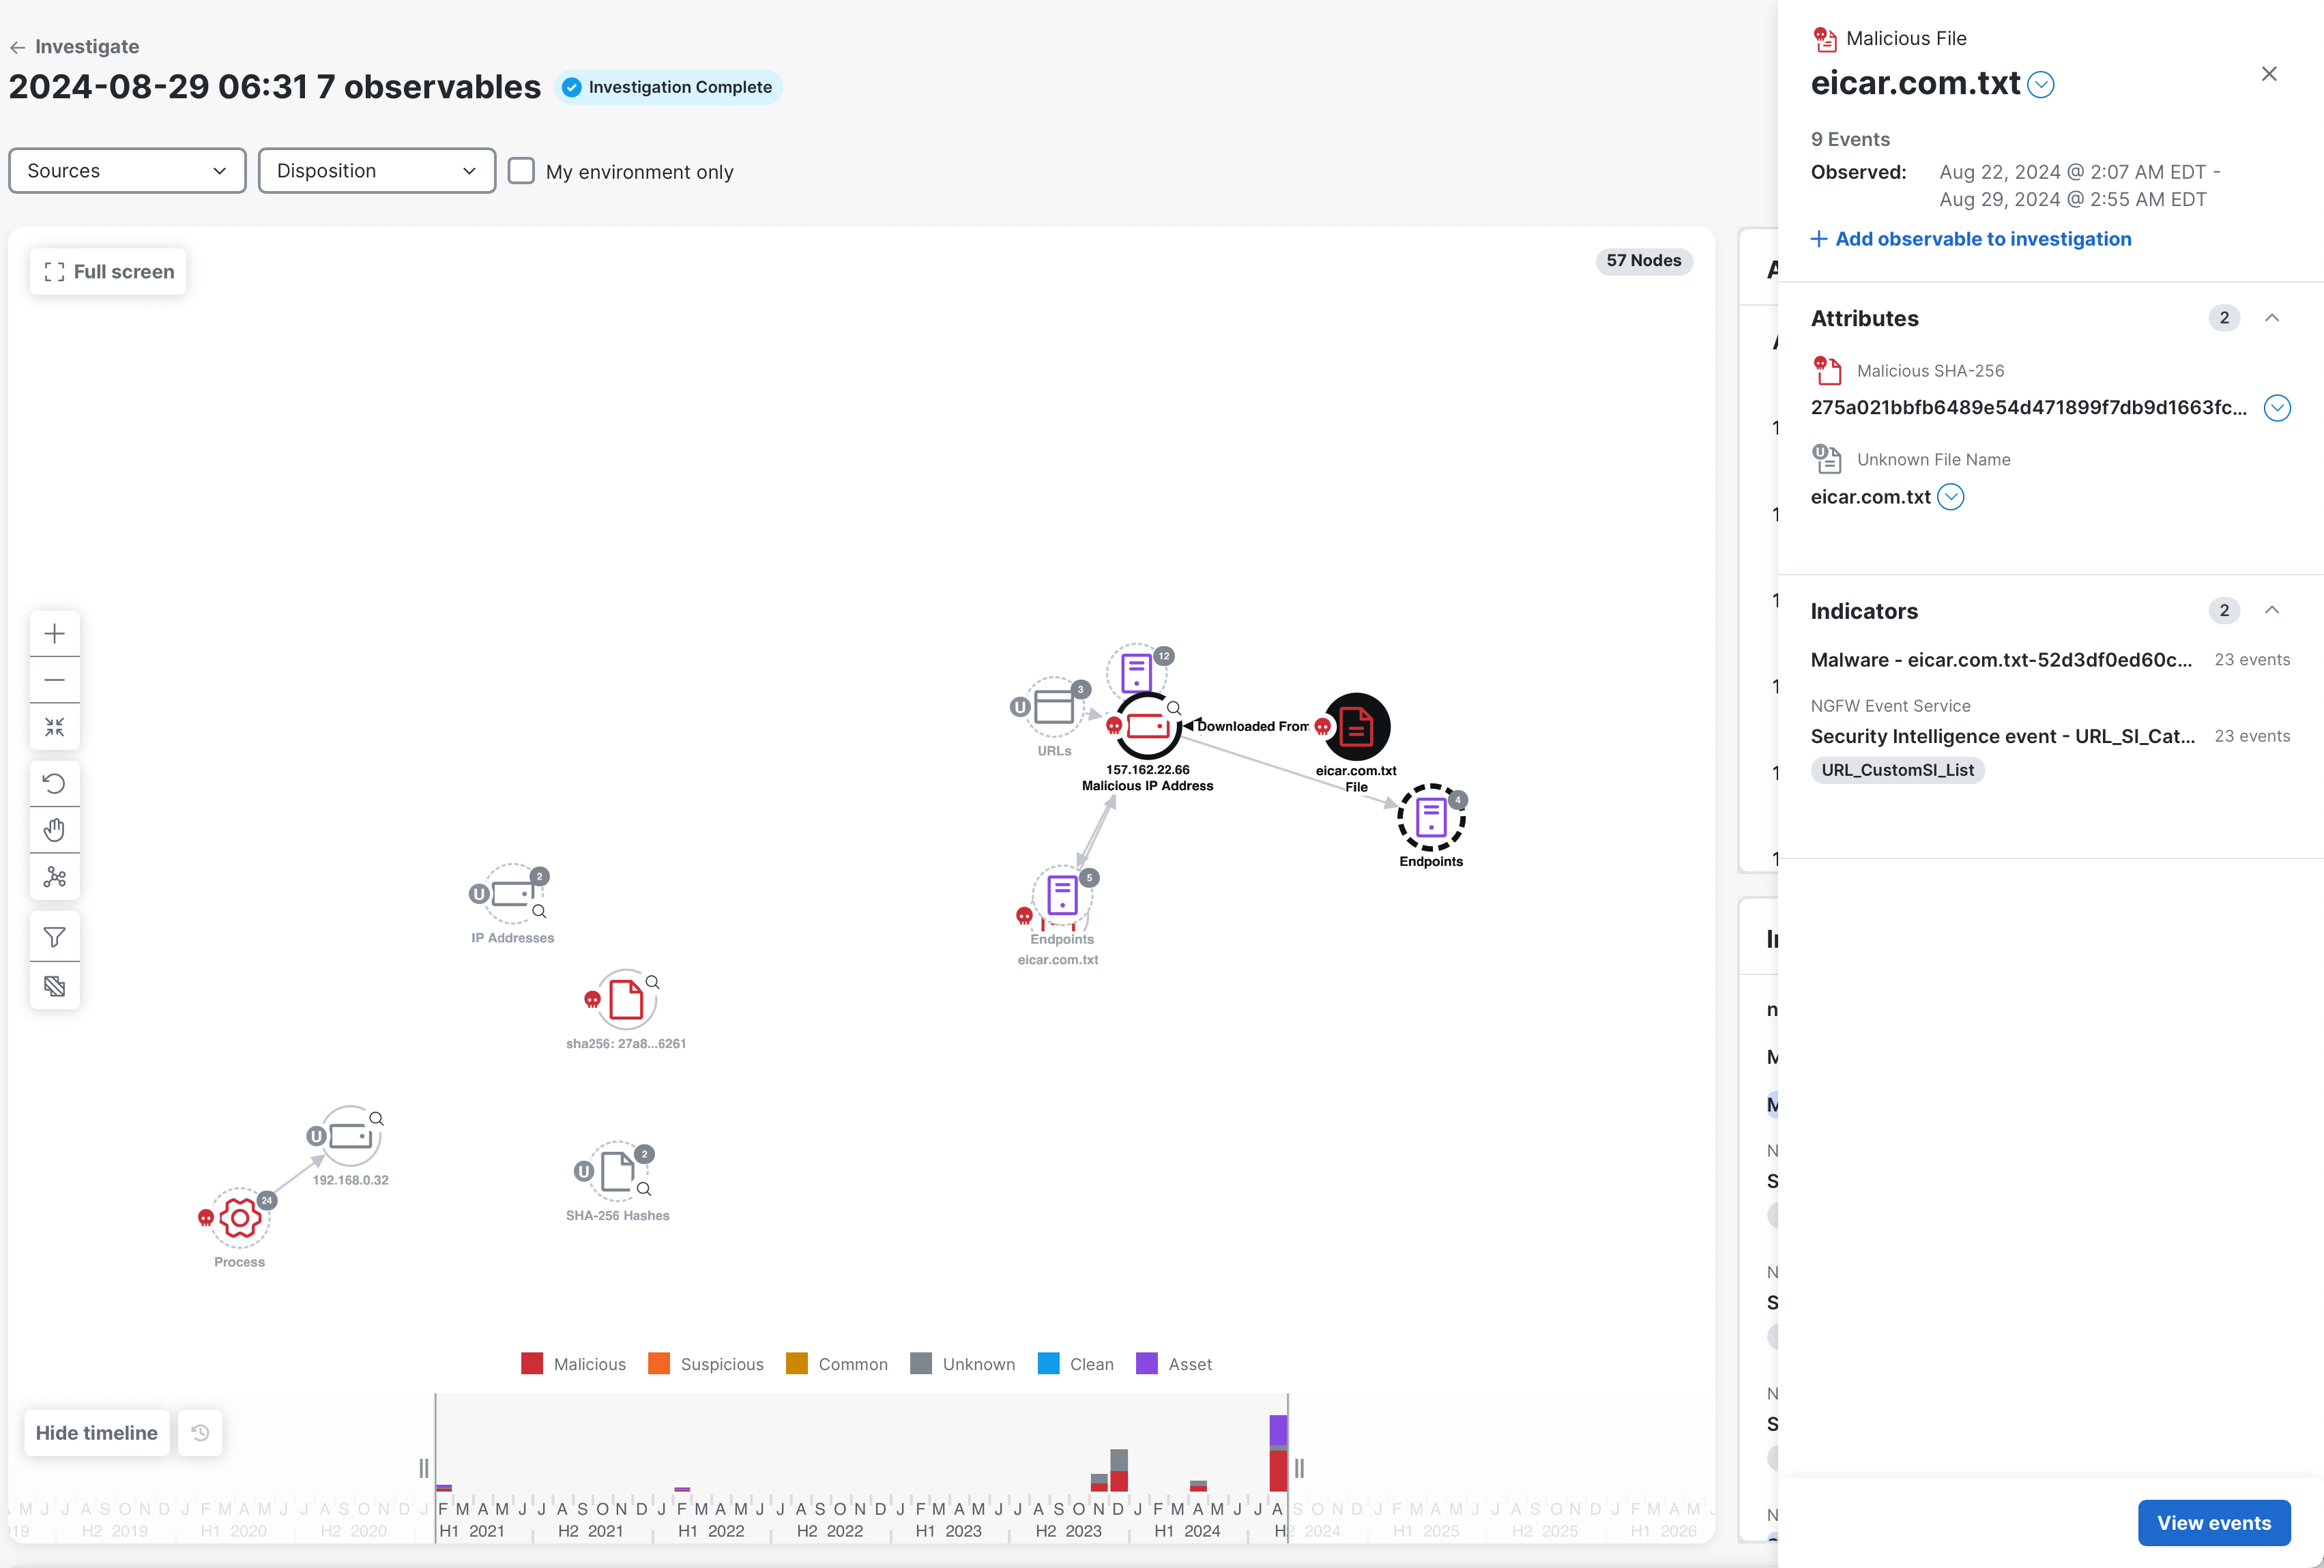
Click a single node in the Relations Graph panel to see more information in the Node drawer, such as the number of events that were included with that specific node, when they were seen, and the observables and indicators that have been identified. If the nodes are grouped, double-click the grouped node and then click a node in the group to open the drawer (see Group Nodes).
If the asset is available in Cisco XDR Devices, the View in devices link is displayed to open and view it in the Inventory table. The device tags associated with the asset are also displayed in the drawer.
If applicable, the Actions Taken area in the node drawer displays the remedial actions that have been executed by the integrated Endpoint Detection and Response (EDR) source for the selected observable. These actions involve proactive measures, such as blocking or quarantining to manage and mitigate identified threats or security incidents, and these actions also display observable data, if available. The badge next to the source indicates the action taken and the list of actions is sorted by latest to oldest. If there are six or more actions taken, the View all actions taken link is displayed and it opens another drawer with a complete list of all the actions taken for the device. Use the Source and Action drop-down lists in the upper portion of the drawer to narrow the list of all the actions taken and only show those actions that match the filters you have selected.
Click View events in the lower portion of the drawer to view information about the specific event in the Events panel.
After running an investigation, if additional observables were found that were not part of the original investigation, you can add observables to the investigation. If the investigation is a saved investigation and additional observables were found that were not part of the original investigation, you can add the additional observables to the investigation, which will create a cloned investigation with new results. You can also remove observables from an investigation and save the investigation with the new results.
For more information, see Add or Remove Observables in Investigation.
For more information, see the Relations Graph help topic.
The Timeline panel is displayed beneath the Relations Graph panel by default. This panel shows a color-coded timeline (based on disposition) of the volume of events at different points in time. You can hide the panel by clicking the Hide timeline button.
Hover any point on the timeline to open a tooltip that shows the total number of observables and assets and the disposition relevant to all events that started at that specific time.
Move the side handles on the timeline to zoom in or a specific event or zoom out. When you zoom in on the event, it also narrows the display of nodes on the graph.
To refresh the timeline, click the ![]() (Timeline Refresh) icon.
(Timeline Refresh) icon.
For more information, see the Timeline help topic.
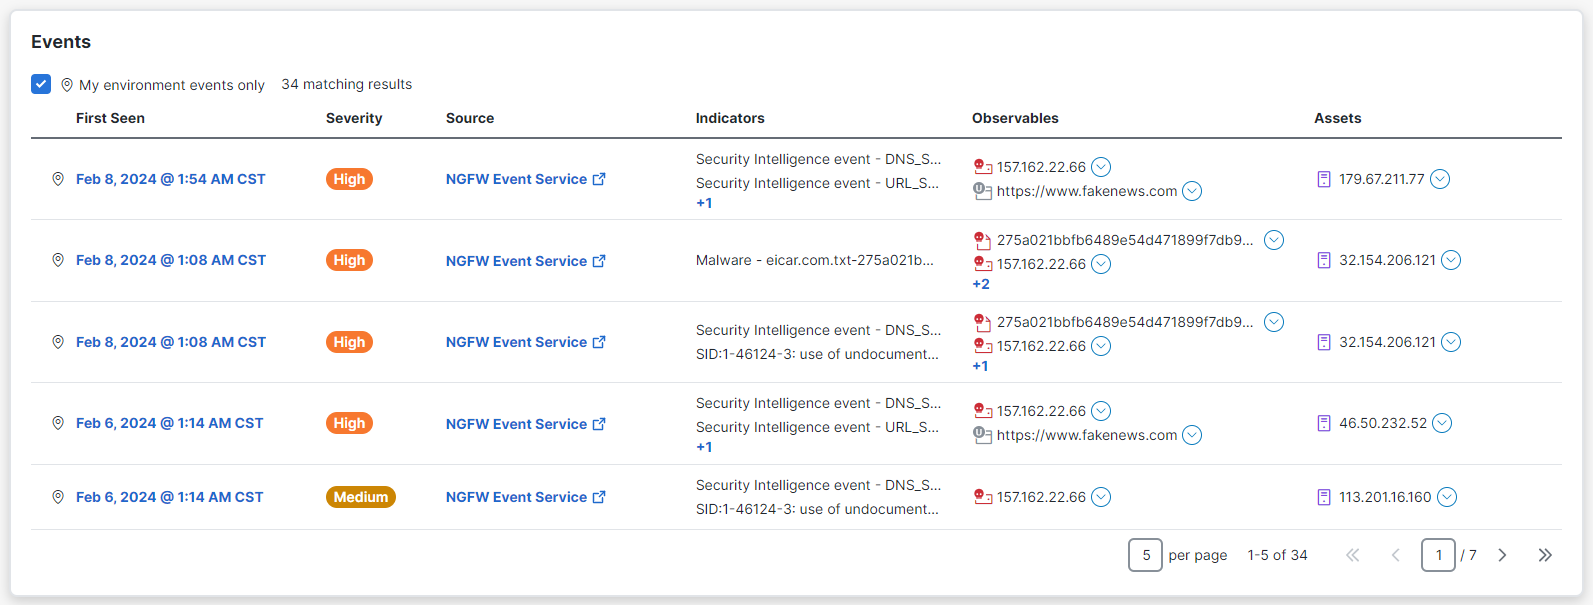
The Events table displays a list of all the events seen in the investigation. It includes event details, such as the date and time the event was first observed, the source of the event, and a list of all observables reported in the events that occurred at that time. Click the Source link to open the event in the originating product.
For more information, see the Events help topic.
The Assets and Observables panel displays more information about the assets and observables seen in the current investigation.
You can select an asset or observable in the list to highlight the node in the Relations Graph panel. To select multiple assets and observables, press the ctrl key (Windows) or command key (Mac) while clicking the items in the list. You can also select the node in the Relations Graph panel to highlight the assets and observables associated with the node in the Assets and Observables panel. See Sync and Highlight Observables and Indicators for more information.
Click the ![]() (Pivot Menu) icon next to an asset or observable to open the Pivot menu and view the verdicts, investigate it, create a judgment, or perform additional tasks by leveraging your integrated Cisco products.
(Pivot Menu) icon next to an asset or observable to open the Pivot menu and view the verdicts, investigate it, create a judgment, or perform additional tasks by leveraging your integrated Cisco products.
Assets
Expand the Assets panel to view the total number and list of assets based on the most frequently seen to the least frequently seen in the investigation. Each asset is represented by a color-coded purple icon based on asset type, and includes the asset name, source, value, and labels.
Observables
Expand the Observables panel to view the total number and list of observables that were seen in the investigation. The ![]() (Investigated) icon and label display next to the observables that were included in the initial investigation; observables without this icon were added during the enrichment process.
(Investigated) icon and label display next to the observables that were included in the initial investigation; observables without this icon were added during the enrichment process.
For more information, see the Assets and Observables help topic.
The Indicators panel displays the total number and list of indicators that were observed in the investigation, sorted by most frequently to least frequently seen.
You can select an indicator in the list to highlight the node in the Relations Graph panel. To select multiple indicators, press the ctrl key (Windows) or command key (Mac) while clicking the items in the list. You can also select the node in the Relations Graph panel to highlight the indicators associated with the node in the Indicators panel. Click anywhere in the panels to clear your selections. See Sync and Highlight Observables and Indicators for more information.
For more information, see the Indicators help topic.
The syncing and highlighting capability provides the ability to easily see the assets, observables, indicators, and events associated with the nodes in the Relations Graph panel. When you select an asset or observable in the Relations Graph panel, it is highlighted in the Assets and Observables panel, the indicators associated with the selected node are highlighted in the Indicators panel, and the events are highlighted in the Events table.
To select multiple nodes in the graph, press the ctrl key (Windows) or command key (Mac) while clicking the nodes or use the ![]() (Select) icon in the Graph Controls.
(Select) icon in the Graph Controls.
You can also select a label for an asset in the Assets and Observables panel or Asset Labels drawer to highlight all asset nodes in the Relations Graph panel that contain that asset label. This, in turn, highlights all other assets in the Assets and Observables panel, Indicators panel, and Events table that are associated with the nodes highlighted in the Relations Graph panel. Asset labels are present if the asset is assigned labels in Cisco XDR Devices.
To select multiple labels in the Assets and Observables panel, press the ctrl key (Windows) or command key (Mac) while clicking the labels or use the ![]() (Select) icon in the Graph Controls.
(Select) icon in the Graph Controls.
To clear the selection, click anywhere in any of the panels to remove the sync.
The number of labels displayed in the Assets and Observables panel depends on the length of the label. Any additional labels are indicated by a +n value (for example, +1). To view all the labels, click the +n link to open the Asset Labels drawer. From the drawer, you can see all the labels that are associated with the asset. You also have the same functionality to sync from the drawer as you do from the Assets and Observables panel.
You can save the investigation to keep a record for yourself and to share with others. Saved investigations can also provide evidence to justify a course of action. When saving an investigation, the investigation is assigned a unique identifier for subsequent retrieval and analysis, which is accessible on the Saved Investigation page.
Note: The Save button is not displayed when viewing an already saved investigation.
Perform the following steps to take a snapshot of your investigation and save it to share with others:
-
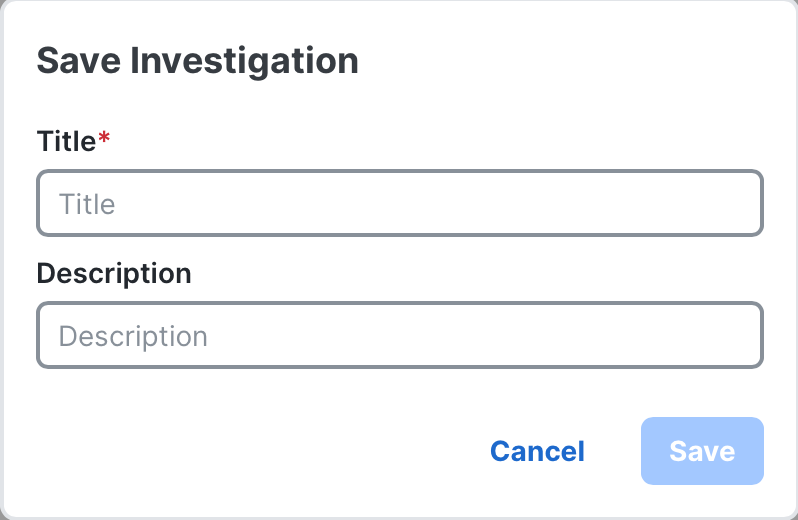
Click Save in the upper right corner.
-
On the Save Investigation dialog box, enter a Title and Description (optional).
-
Click Save.
The investigation is now accessible from the Saved Investigations page. For more information, see the Saved Investigations help topic.
Note: When you save an investigation, it is tied to the account you used to log in. For example, if you save an investigation while logged in using your Secure Endpoint account, it will not be available to you when you’re logged in with your Secure Malware Analytics account.
When viewing a saved investigation, you have the ability to edit the name. Click the (Edit) icon next to the name in the header and enter a new name. Press Enter on your keyboard or click anywhere outside the title area to save the new name.

Note: This functionality is only available when viewing the results of a saved investigation.
