Events
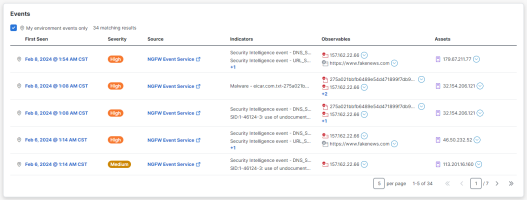
The Events panel on the Investigation Results page displays data associated with the events in the investigation. You can sort and filter the list, and open the Event drawer to view the details of the events.
By default, the My environment events only check box on the Events table is enabled and checked to show only events in your environment, as indicated by the ![]() (Internal Event) icon. If the My environment only check box in the upper portion of the page is unchecked, you can uncheck the My environment events only check box to show all events (internal and external to your environment) in the Events table.
(Internal Event) icon. If the My environment only check box in the upper portion of the page is unchecked, you can uncheck the My environment events only check box to show all events (internal and external to your environment) in the Events table.
Note: If the My environment only check box is checked, the My environment events only check box becomes disabled and cannot be toggled to show all events (internal and external) because the page filter overrides the Events table filter.
Each row in the table includes data from the event in the investigation.
|
Column Name |
Description |
|---|---|
|
First Seen |
Date and time the event was first observed. The events are sorted by timestamp and you can choose to sort newest to oldest (Ascending) or oldest to newest (Descending) using the sort icon in the column heading. |
|
Severity |
The threat level given to the event (Critical, High, Medium, Low, None, Unknown, Info). You can sort the events by highest to lowest severity (Descending) or lowest to highest severity (Ascending) using the sort icon in the column heading. |
|
Source |
Cisco XDR integration module or source that promoted the event. Click the Source link to open the event in the originating product. You can sort the sources alphabetically using the sort icon in the column heading. |
|
Indicators |
List of indicators the event is related to via a event-of relationship. |
|
Observables |
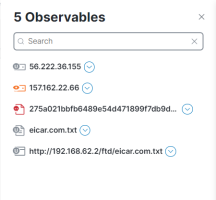
The first three observables that were contained in the event, and dispositions of the observables taken from verdicts. The observables are color-coded and sorted based on the disposition. If more than three observables were seen in the event, the number of additional observables is displayed in an Overflow tag beneath the list. Click the + more link to open the Observables drawer and view all the observables seen in the event. Click the |
|
Assets |
The assets that were seen in the event, where the displayed asset values are based on strong identifier types. The assets are represented by color-coded purple icons that are based on the asset type (see Graph Icon Descriptions). Click the |
You can reorder the columns in the table and select the columns displayed to customize the table for the data you want to view.
To reorder the table columns, click and drag a column header to the desired position in the table.
Click the ![]() (Settings) to open the Display Settings drawer and check the check boxes next to the columns you want displayed in the events table. If custom columns are displayed, click Reset to defaults to reset the table column settings to its default values.
(Settings) to open the Display Settings drawer and check the check boxes next to the columns you want displayed in the events table. If custom columns are displayed, click Reset to defaults to reset the table column settings to its default values.
When you click an event in the list, the Event drawer opens where you can quickly view the details. The drawer includes a summary of the event, timestamp for when it was first seen, last seen (if applicable), severity, the reporting module and source, a short and long description, and the observables, assets, indicators, and relationships between observables in the event.
Click the Source link to open the integration instance that reported it.
Expand the Relations panel in the drawer to view the relationship between the observables seen in the event, such as Connected to or Downloaded from. This is the relationship between observables as shown on the directional arrow that connects the nodes on the Relations Graph.
Expand the Indicators panel to view the total number and list of indicators that were observed in the event. The producer, tags, and number of events associated with each indicator is also displayed.
Expand the Assets panel to view the total number and list of assets that were seen in the event Each asset is represented by a color-coded purple icon based on asset type, and includes the asset name, source, value, and labels.
Expand the Observables panel to view the total number and list of observables that were seen in the event.
Click the ![]() (Pivot Menu) icon next to the observables, assets, or relations to view the disposition, observable type, and verdicts, and perform additional tasks by leveraging your integrated products. See the Pivot Menu help topic for more information.
(Pivot Menu) icon next to the observables, assets, or relations to view the disposition, observable type, and verdicts, and perform additional tasks by leveraging your integrated products. See the Pivot Menu help topic for more information.


