Timeline
The Timeline panel expands beneath the Relations Graph panel by default and displays a color-coded timeline (based on disposition) of the volume of events at different points in time. You can hide the panel by clicking the Hide timeline button.
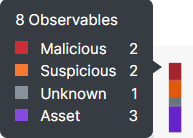
Hover any point on the timeline to open a tooltip that shows the total number of observables and assets and the disposition relevant to all events that started at that specific time.
Move the side handles on the timeline to zoom in on a specific event or zoom out. When you zoom in on the event, it also narrows the display of nodes on the graph to reflect the selection in the timeline.
To refresh the timeline, click the ![]() (Timeline Refresh) icon.
(Timeline Refresh) icon.

