Relations Graph
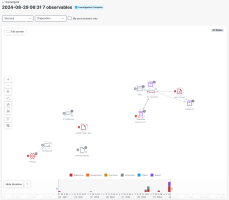
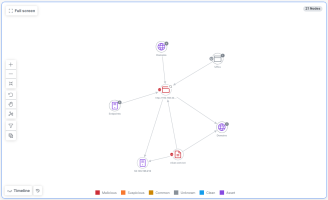
After the investigation has completed, the observables and their known relationships are displayed as a force-directed graph in the Relations Graph panel on the Investigation Results page.
You can click the ![]() (Full screen) icon to expand the Relations Graph panel to improve visibility.
(Full screen) icon to expand the Relations Graph panel to improve visibility.
Use the Graph Controls in the upper portion of the graph to change the layout and view, and to filter and group the nodes that are displayed:
| Icon | Description |
|---|---|
|
|
Full screen/Exit full screen - Located in the upper left corner of the panel; click these icons to expand the panel to full screen or collapse the panel to the default view. |
|
|
Zoom in - Click this icon to decrease the view of information within the panel. |
|
|
Zoom out - Click this icon to enlarge the information within the panel. |
|
|
Fit to view - Click this icon to recenter the graph within the panel when the panel is expanded to full screen. |
|
|
Rearrange - Click this icon to reflow the nodes and recenter the graph. |
|
|
Pan or Select - Pan is set by default to drag an object; click the icon to switch it to Select mode where you can click an object. |
|
|
Layout - Changes the layout to one of the following options:
|
|
|
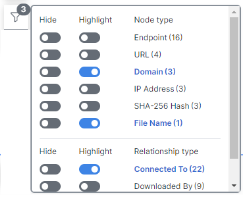
Filter - Click this icon to filter the nodes that are displayed in the graph by Node type and Relationship type. Click the Hide or Highlight toggle for the nodes or relationships you want to filter. The number of selected filters is displayed as a badge on the |
|
|
Group/Ungroup - Click these icons to group or ungroup the nodes on the graph based on node conditions, node count, and user selection. The nodes are grouped by default when the node count is 2 or higher. Nodes that have identical type and disposition and relationship structure can be grouped. See Group Nodes for more information. |
The observables are represented on the graph as nodes (see Graph Icon Descriptions). The ![]() (Investigated) icon on the node indicates that the observable was included in the initial investigation; observables without this icon were added during the enrichment process. The badge on the node displays the number of objects that have been unified and the disposition icon is displayed on the left side of the node, if applicable. For details, see Color and Icon Key. The
(Investigated) icon on the node indicates that the observable was included in the initial investigation; observables without this icon were added during the enrichment process. The badge on the node displays the number of objects that have been unified and the disposition icon is displayed on the left side of the node, if applicable. For details, see Color and Icon Key. The ![]() (Actions Taken) icon on the node indicates that remedial actions have been executed by the integrated Endpoint Detection and Response (EDR) source for the device.
(Actions Taken) icon on the node indicates that remedial actions have been executed by the integrated Endpoint Detection and Response (EDR) source for the device.
Right-click a node on the graph to open the Pivot menu that enables you to take action on the node. You can perform some actions directly in the Pivot menu or pivot to the integrated product to perform additional actions. If the nodes are grouped, double-click the grouped node to expand it and then right-click a node to open the Pivot menu.
You can reposition any of the nodes on the graph by clicking and dragging to another position, or click in a white space and drag the graph side to side, or up and down.
You can filter the nodes by type and directional relationship to narrow the display. Click the ![]() (Filter) icon and toggle to Hide or Highlight the Node type and Edge type you want to be displayed in the graph. Once the Filter menu is closed, the number of selected filters is displayed as a badge on the
(Filter) icon and toggle to Hide or Highlight the Node type and Edge type you want to be displayed in the graph. Once the Filter menu is closed, the number of selected filters is displayed as a badge on the ![]() (Filter) icon.
(Filter) icon.
An asset represents the device, identity, or resource that a threat has targeted and is identified by one or more observables. Assets are connected by lines to other related nodes in the graph.
When assets and observables (or other assets) have the same strong identifier, they are unified into one asset node to simplify the view. Asset unification occurs:
- With any one asset in the graph irrespective of the type or module where it originated. If there are other assets that match the observable, they will be ignored.
- If the observable is found in the asset’s list of observables.
- When asset nodes are from the same module based on their strong identifiers (observables) which don’t change over time, such as AMP GUID or ODNS identity.
- When assets from different modules have IP addresses within an overlapping time range.
A dashed line between assets on the graph indicates that it’s a weak relationship. A label at midpoint shows how the assets are connected (for example, Connected by IP Address). When you hover over the line, a tool tip provides details about the weak relationship.
During an investigation, an attempt is made to resolve the assets that were identified in the investigation to assets in the Inventory table in Cisco XDR Devices:
-
If there is a match to a single device, the node in the graph is replaced with an icon representing the asset, and all relationships of the that node become the asset relationships. The name of the asset node is the Device Name in the Inventory table.
-
If there are multiple matches to devices, the nodes and their relationships in the graph are preserved, and the nodes are linked to the new asset nodes.
You can view asset details in the Node drawer. Click View in devices to open the Inventory table.
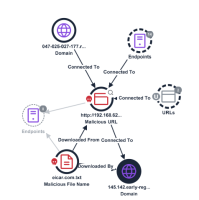
The relationship between nodes is shown on the label of the directional arrow that connects to other nodes.
When there are multiple relationships between nodes on the graph, the label on the directional arrow indicates the number of relationships. If you hover over this label, the relationship types are displayed in a tooltip.
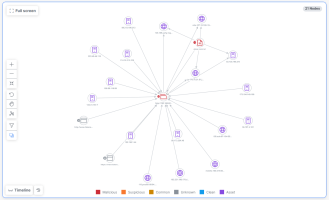
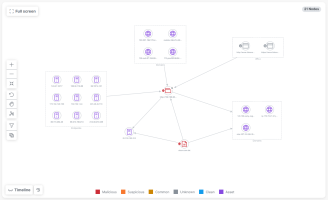
If the node count is 2 or higher and there are nodes with the same type, disposition, and have the same relationship to the same set of observables, they are grouped by default to reduce the noise on the graph. The grouping capability compresses multiple like nodes into one node on the graph.
You can also turn on or turn off the grouping capability using the ![]() (Group) icon and
(Group) icon and ![]() (Ungroup) icon in the Graph Controls on the Relations Graph.
(Ungroup) icon in the Graph Controls on the Relations Graph.
-
Click the
 (Group) icon to compress multiple nodes into one node.
 -
Click the
 (Ungroup) icon to show all nodes on the graph.
When nodes are grouped, the edge is a dotted circle, with a badge that indicates the number of nodes in the group.
In this example, these nodes were grouped because they are of the same observable type and have the same relationship (connected to) another observable.
Click the ![]() (Ungroup) icon to ungroup the nodes and return to the original view.
(Ungroup) icon to ungroup the nodes and return to the original view.
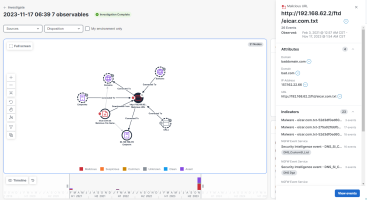
When a node is selected in the graph, the details are displayed in the Node drawer. If the assets are aggregated, the details of all the assets in the aggregation are displayed, including the attributes (events and observables), and indicators that were identified. The attributes are sorted alphabetically by type.
If the asset is available in Cisco XDR Devices, the View in devices link is displayed to open and view it in the Inventory table. The Device Tags associated with the asset are also displayed in the drawer.
Click the ![]() (Pivot Menu) icon next to the observables to open the Pivot menu and view the verdicts associated with the observable, investigate it, create a judgment, or perform additional tasks by leveraging your integrated Cisco products.
(Pivot Menu) icon next to the observables to open the Pivot menu and view the verdicts associated with the observable, investigate it, create a judgment, or perform additional tasks by leveraging your integrated Cisco products.
To view the details about the events, click View events in the lower portion of the drawer to view more information in the Events panel. For more information, see the Events help topic.
After running an investigation, if additional observables were found that were not part of the original investigation, you can add observables to the investigation. If the investigation is a saved investigation and additional observables were found that were not part of the original investigation, you can add the additional observables to the investigation, which will create a cloned investigation with new results. You can also remove observables from an investigation and save the investigation with the new results.
To add observables to your investigation, perform the following steps:
-
Click an observable node in the Relations Graph panel that was not part of the original investigation to open the Node drawer.
-
In the Node drawer, click Add observable to investigation.
Alternatively, click the Pivot menu next to any observable in the Assets and Observables panel that has not been investigated, and then click Add observable to investigation.
If the investigation is a saved investigation, a confirmation message is displayed.
-
Click Continue to add the observable to the investigation.
The original investigation is cloned and opens in a new tab. The investigation runs with the newly added observable and displays the results.
You can continue adding observables to the investigation until the cloned investigation is saved.
-
Once you are done adding observables to the cloned investigation, click Save.
-
On the Save Investigation dialog box, enter a Title and Description for the new investigation and click Save.
Note: Observables that were investigated show the ![]() (Investigated) icon next to it in the graph.
(Investigated) icon next to it in the graph.
Note: If you do not save the investigation before closing the tab, the investigation will be lost.
You can also remove observables from an investigation and save the investigation with the new results.
To remove an observable from the current investigation, perform the following steps:
-
Click the observable node in the Relations Graph panel that you want to remove from the investigation to open the Node drawer.
-
In the Node drawer, click Remove observable from investigation.
Alternatively, click the Pivot menu next to any observable in the Assets and Observables panel that was investigated, and then click Remove observable from investigation.
If the investigation is a saved investigation, a confirmation message is displayed.
-
Click Continue to remove the observable from the investigation.
The original investigation is cloned and opens in a new tab. The investigation runs with the newly removed observable and displays the results.
You can continue removing observables to the investigation until the cloned investigation is saved.
-
Once you are done removing observables from the cloned investigation, click Save.
-
On the Save Investigation dialog box, enter a Title and Description for the new investigation and click Save.
Note: Observables that were investigated show the ![]() (Investigated) icon next to it in the graph.
(Investigated) icon next to it in the graph.
Note: If you do not save the investigation before closing the tab, the investigation will be lost.
