Getting Started with Incident Response
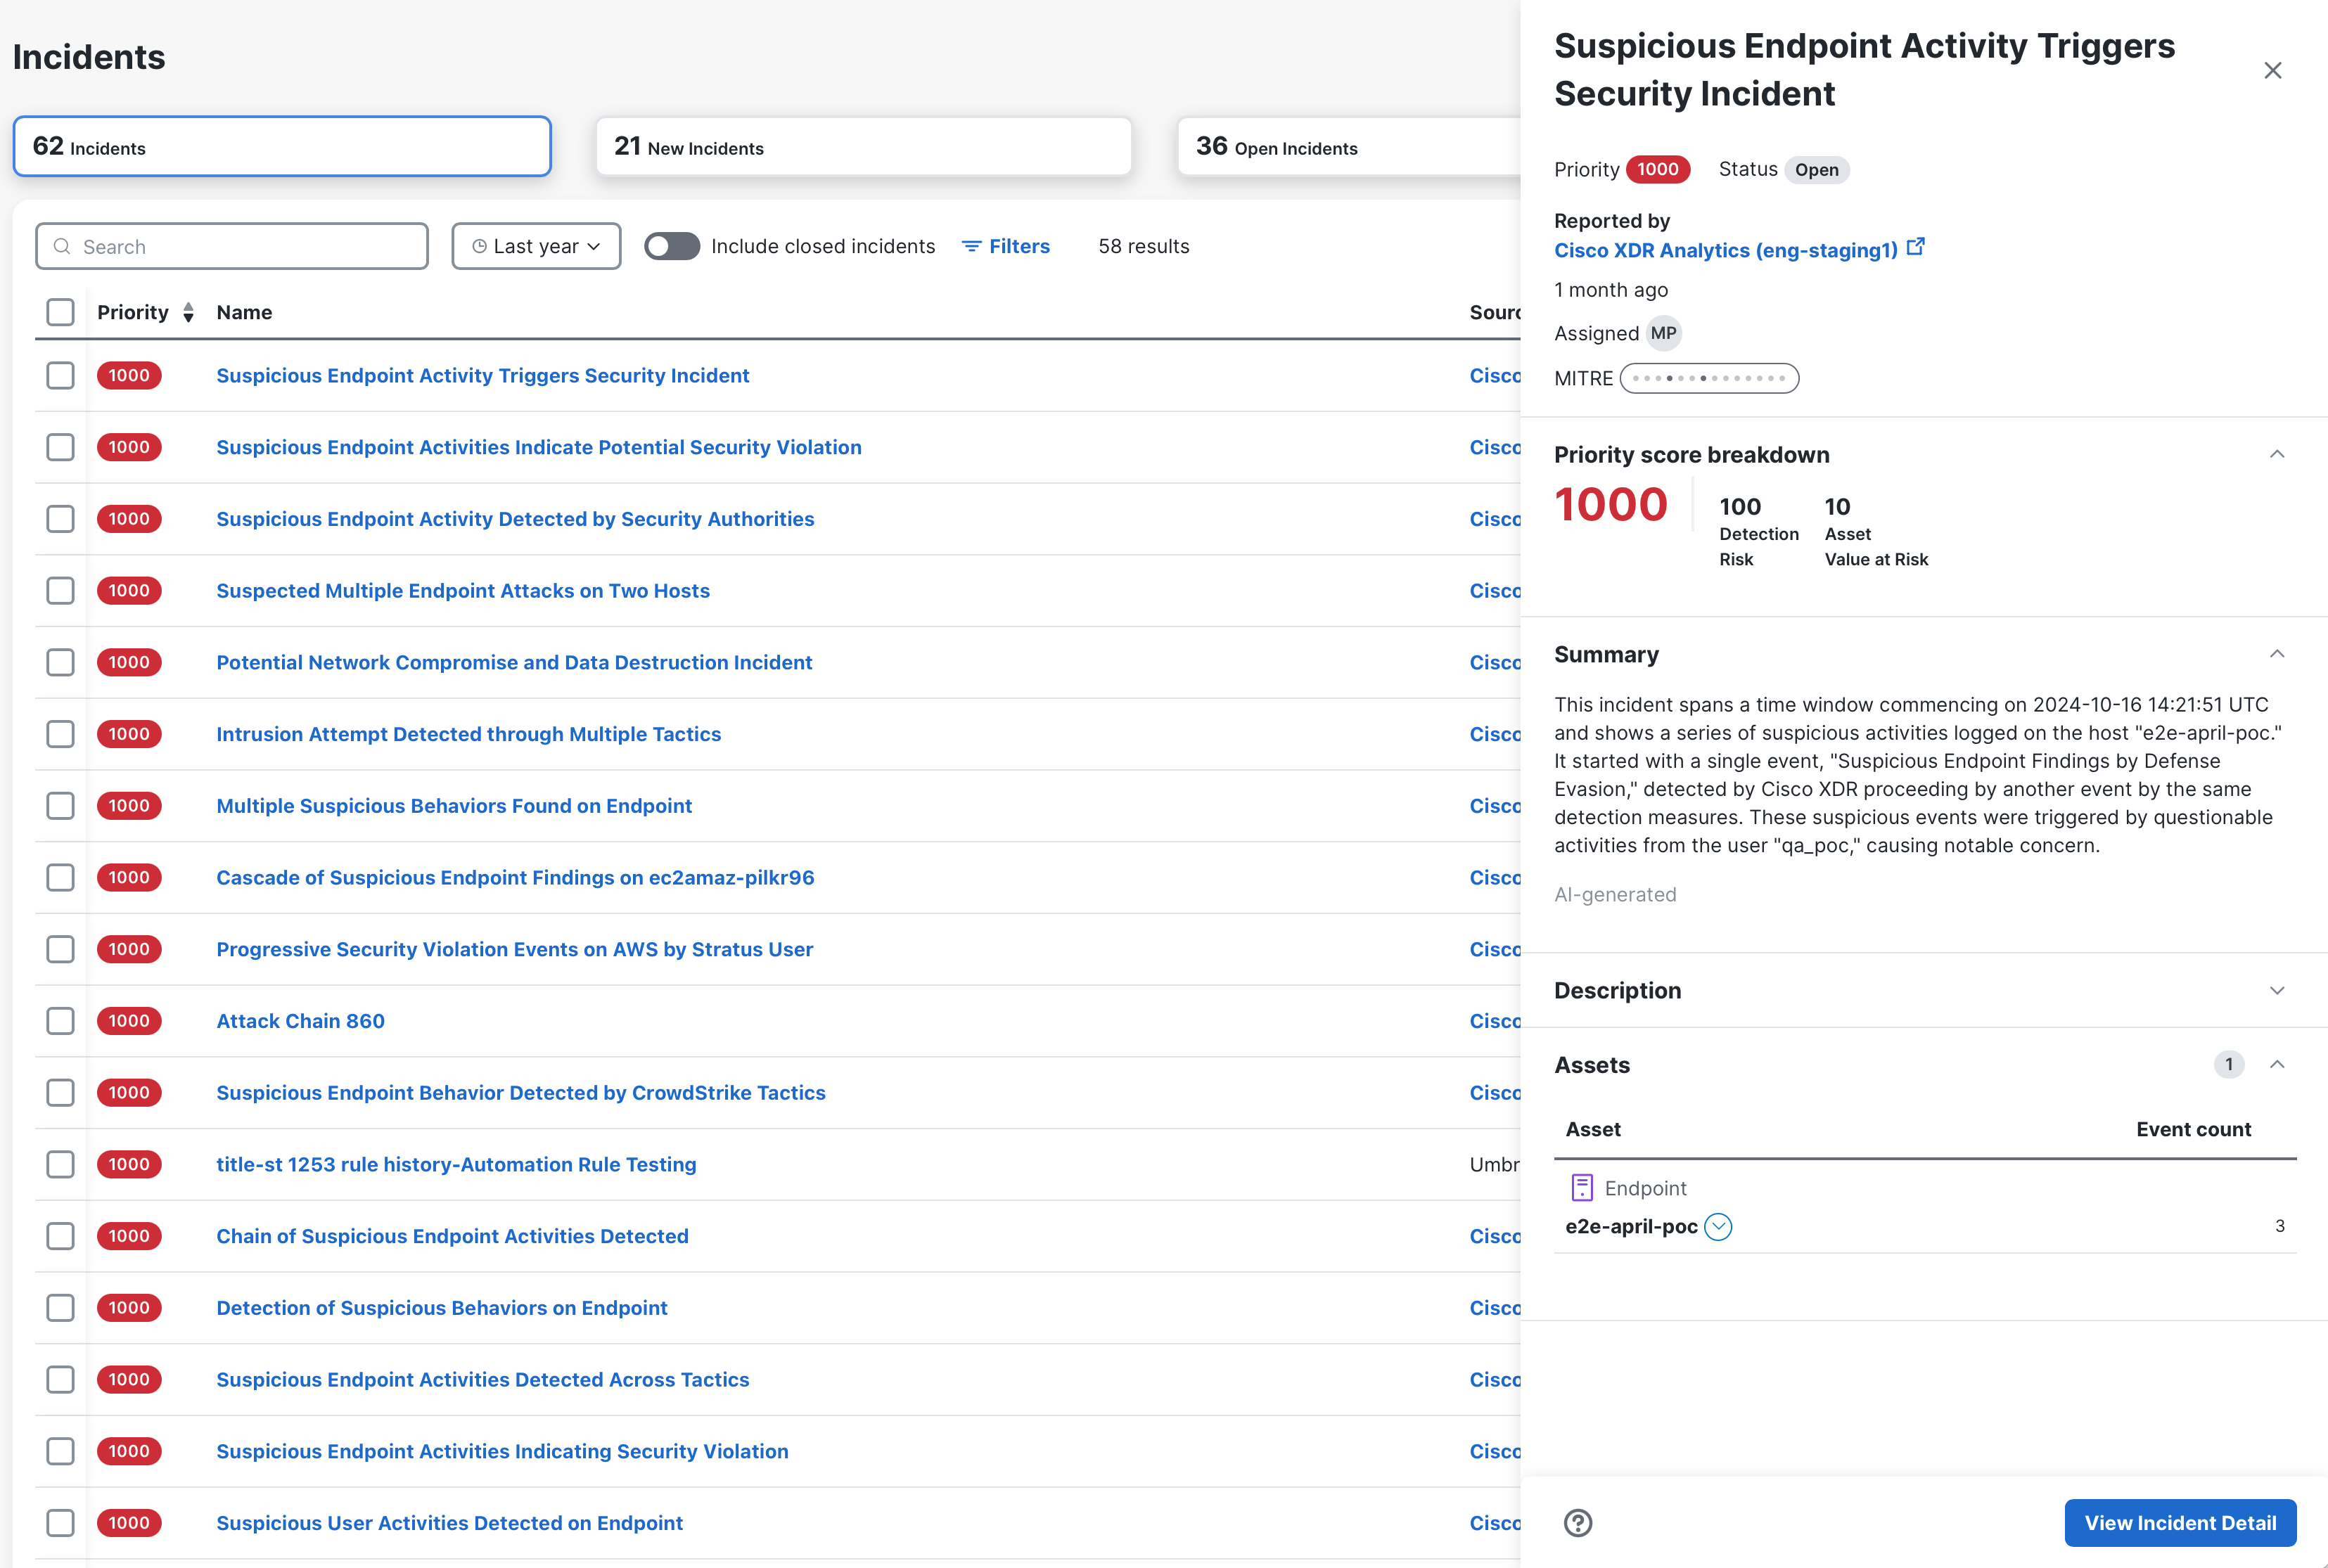
Cisco XDR Incidents is where security analysts and incident responders manage the incidents that have been promoted from security events. Through advanced analytics and correlation, Cisco XDR takes raw telemetry and uses detection logic to create meaningful security events which are shown as incidents.
The incidents are prioritized using an overall priority score calculated from detection risk (including incident severity and TTP-based risk of financial loss) and asset value at risk (based on the value of assets involved in the incident). This ensures that the most critical detections are surfaced at the top of the list, allowing your team to spend time on what really matters.
Select an incident in the list to open the Incident drawer for visibility into additional high-level details, including a breakdown of the priority score, MITRE TTPs, and the assets associated with the incident and number of events where the asset was seen.
Select View Incident Detail in the lower portion of the Incident drawer to open the full incident. The Incident Detail page provides more information about the incident to help you diagnose, contain, and remediate the threat.
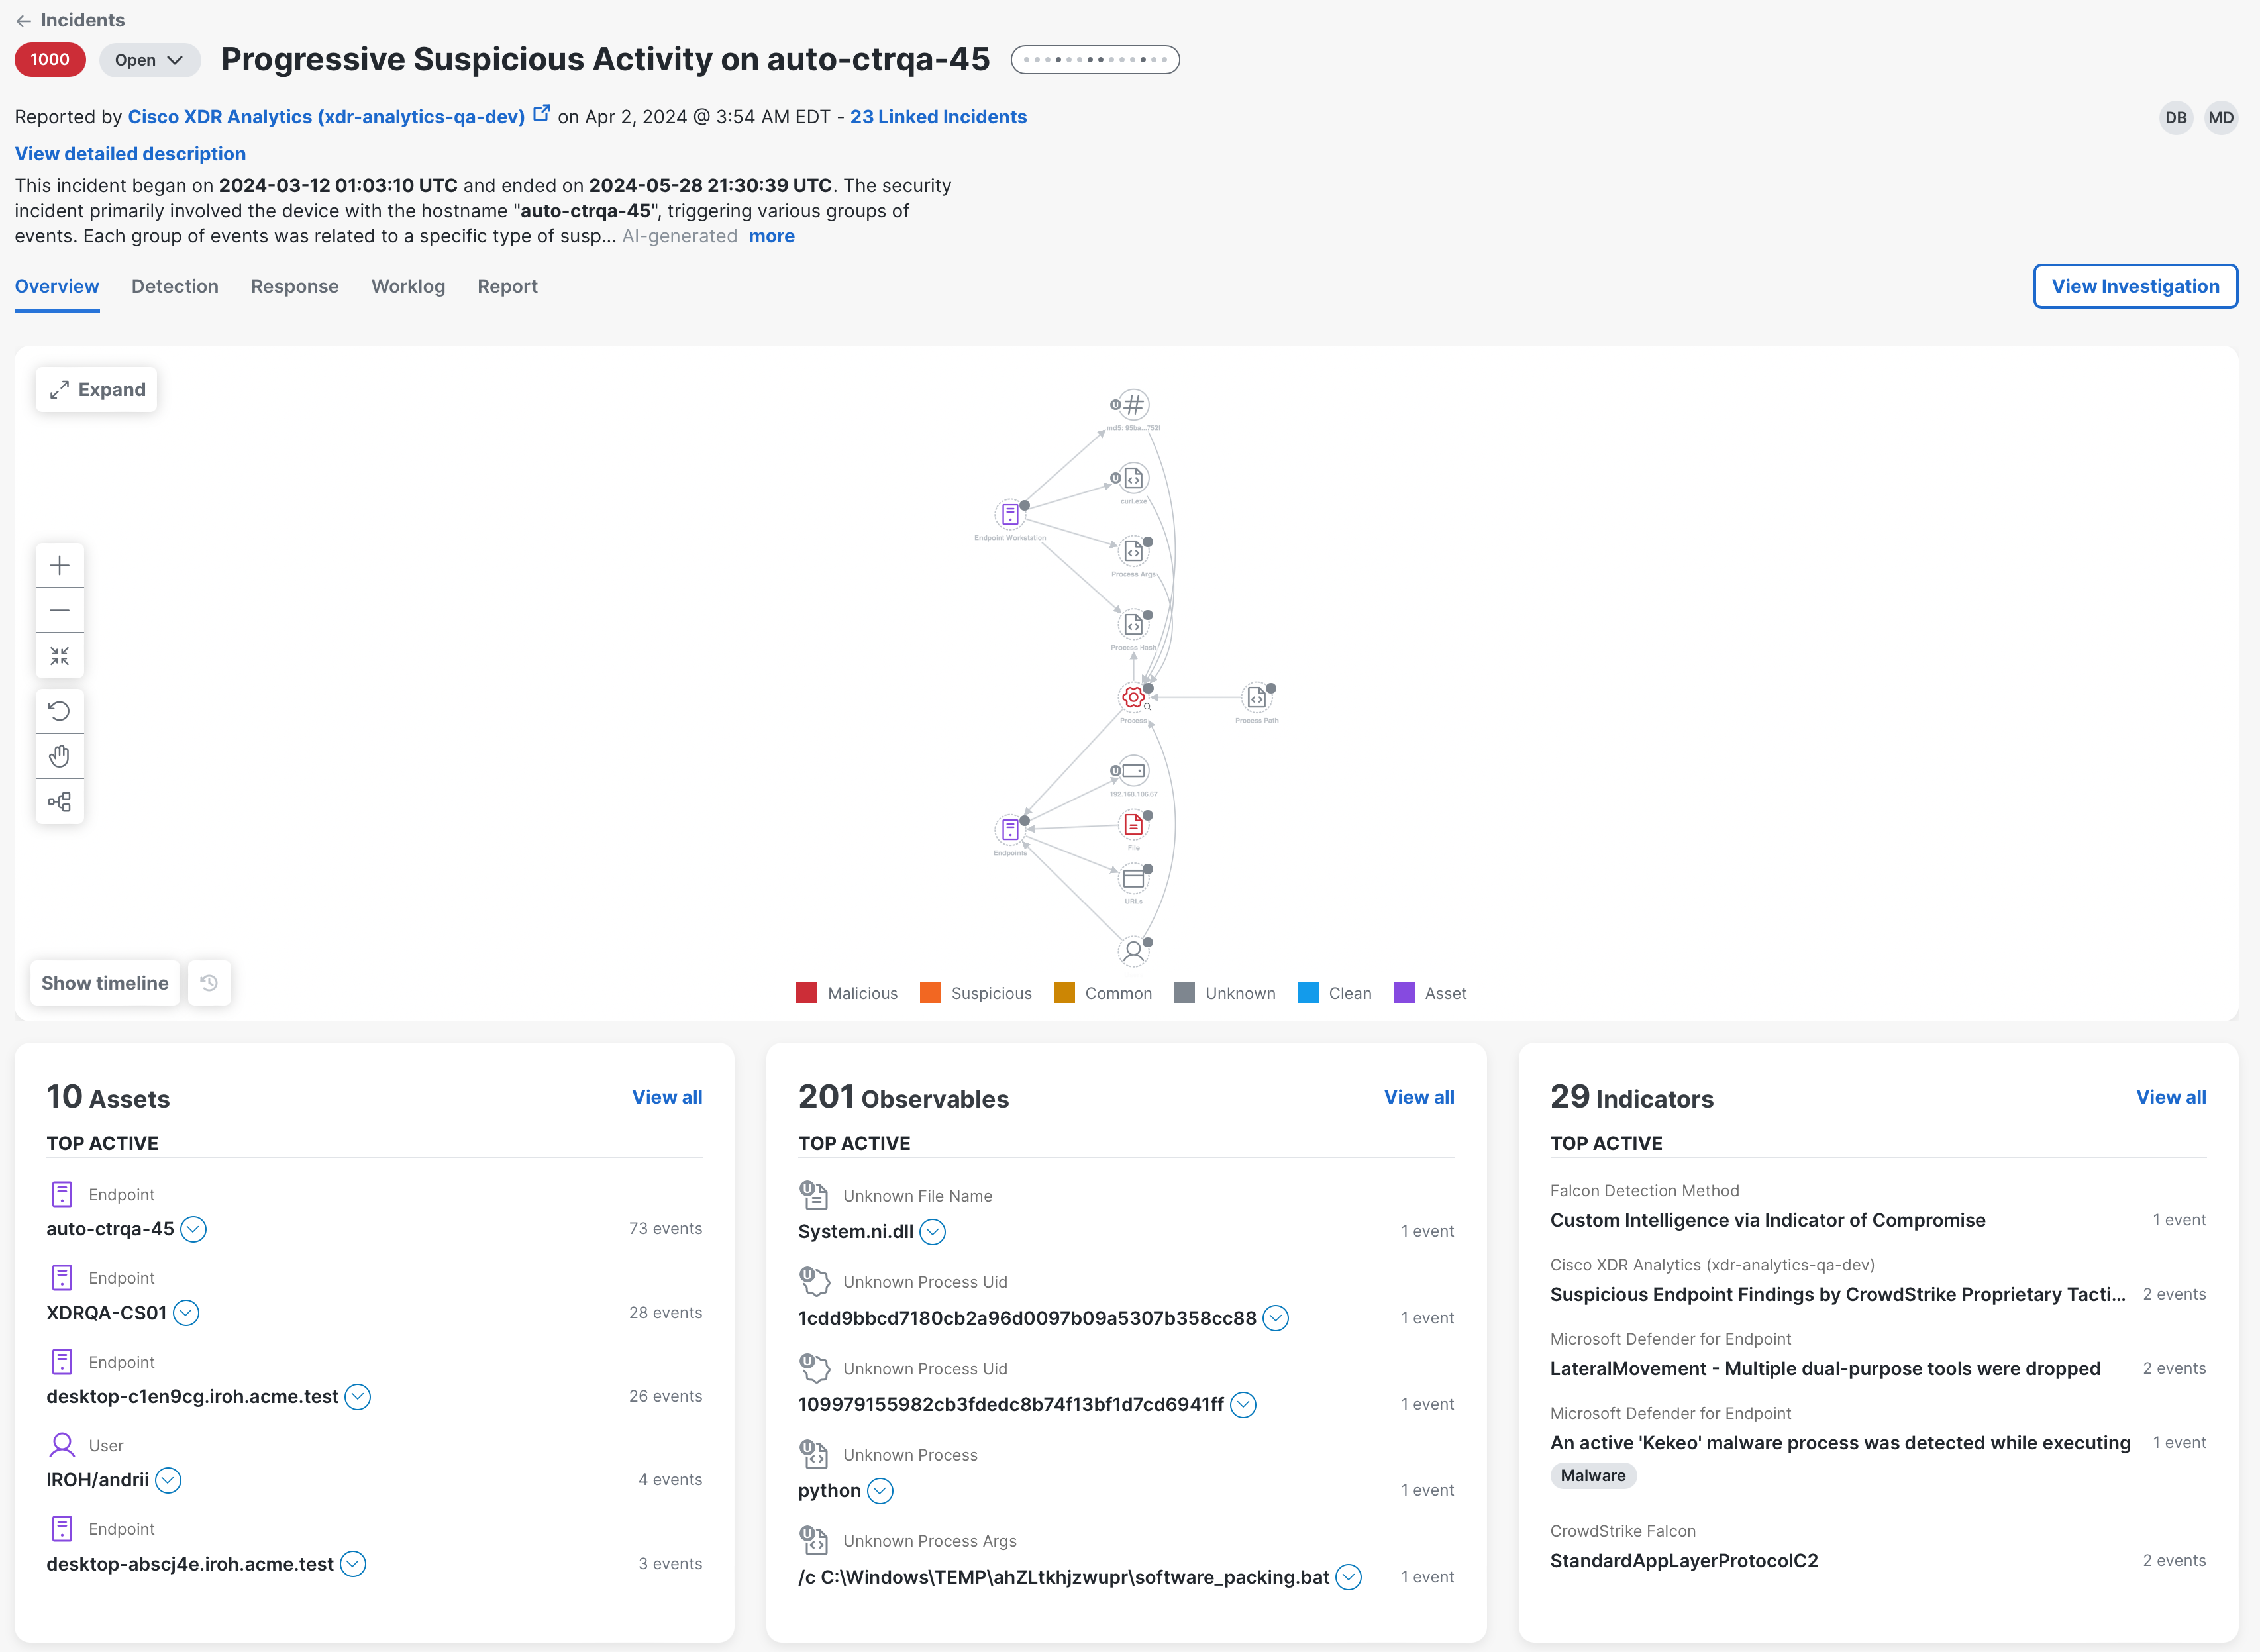
The Overview tab in the incident detail provides an attack graph in the upper portion of the page and overall metric counts of the most important data within the selected incident in the metric cards in the lower portion of the page. For more information, see the Incident Overview help topic.
-
The attack graph displays a compacted relationship view of the investigation of events that caused the incident to be promoted. This view provides a linear progression of the attack at a high level.
-
The metric cards in the lower portion of the page provide a summary of the top active assets, observables, and indicators to help you quickly understand the incident from one view. The metrics are based on the total number of events for the selected incident. Open the drawer on each card to view all assets, observables, and indicators associated with the incident, and to view in the investigation.
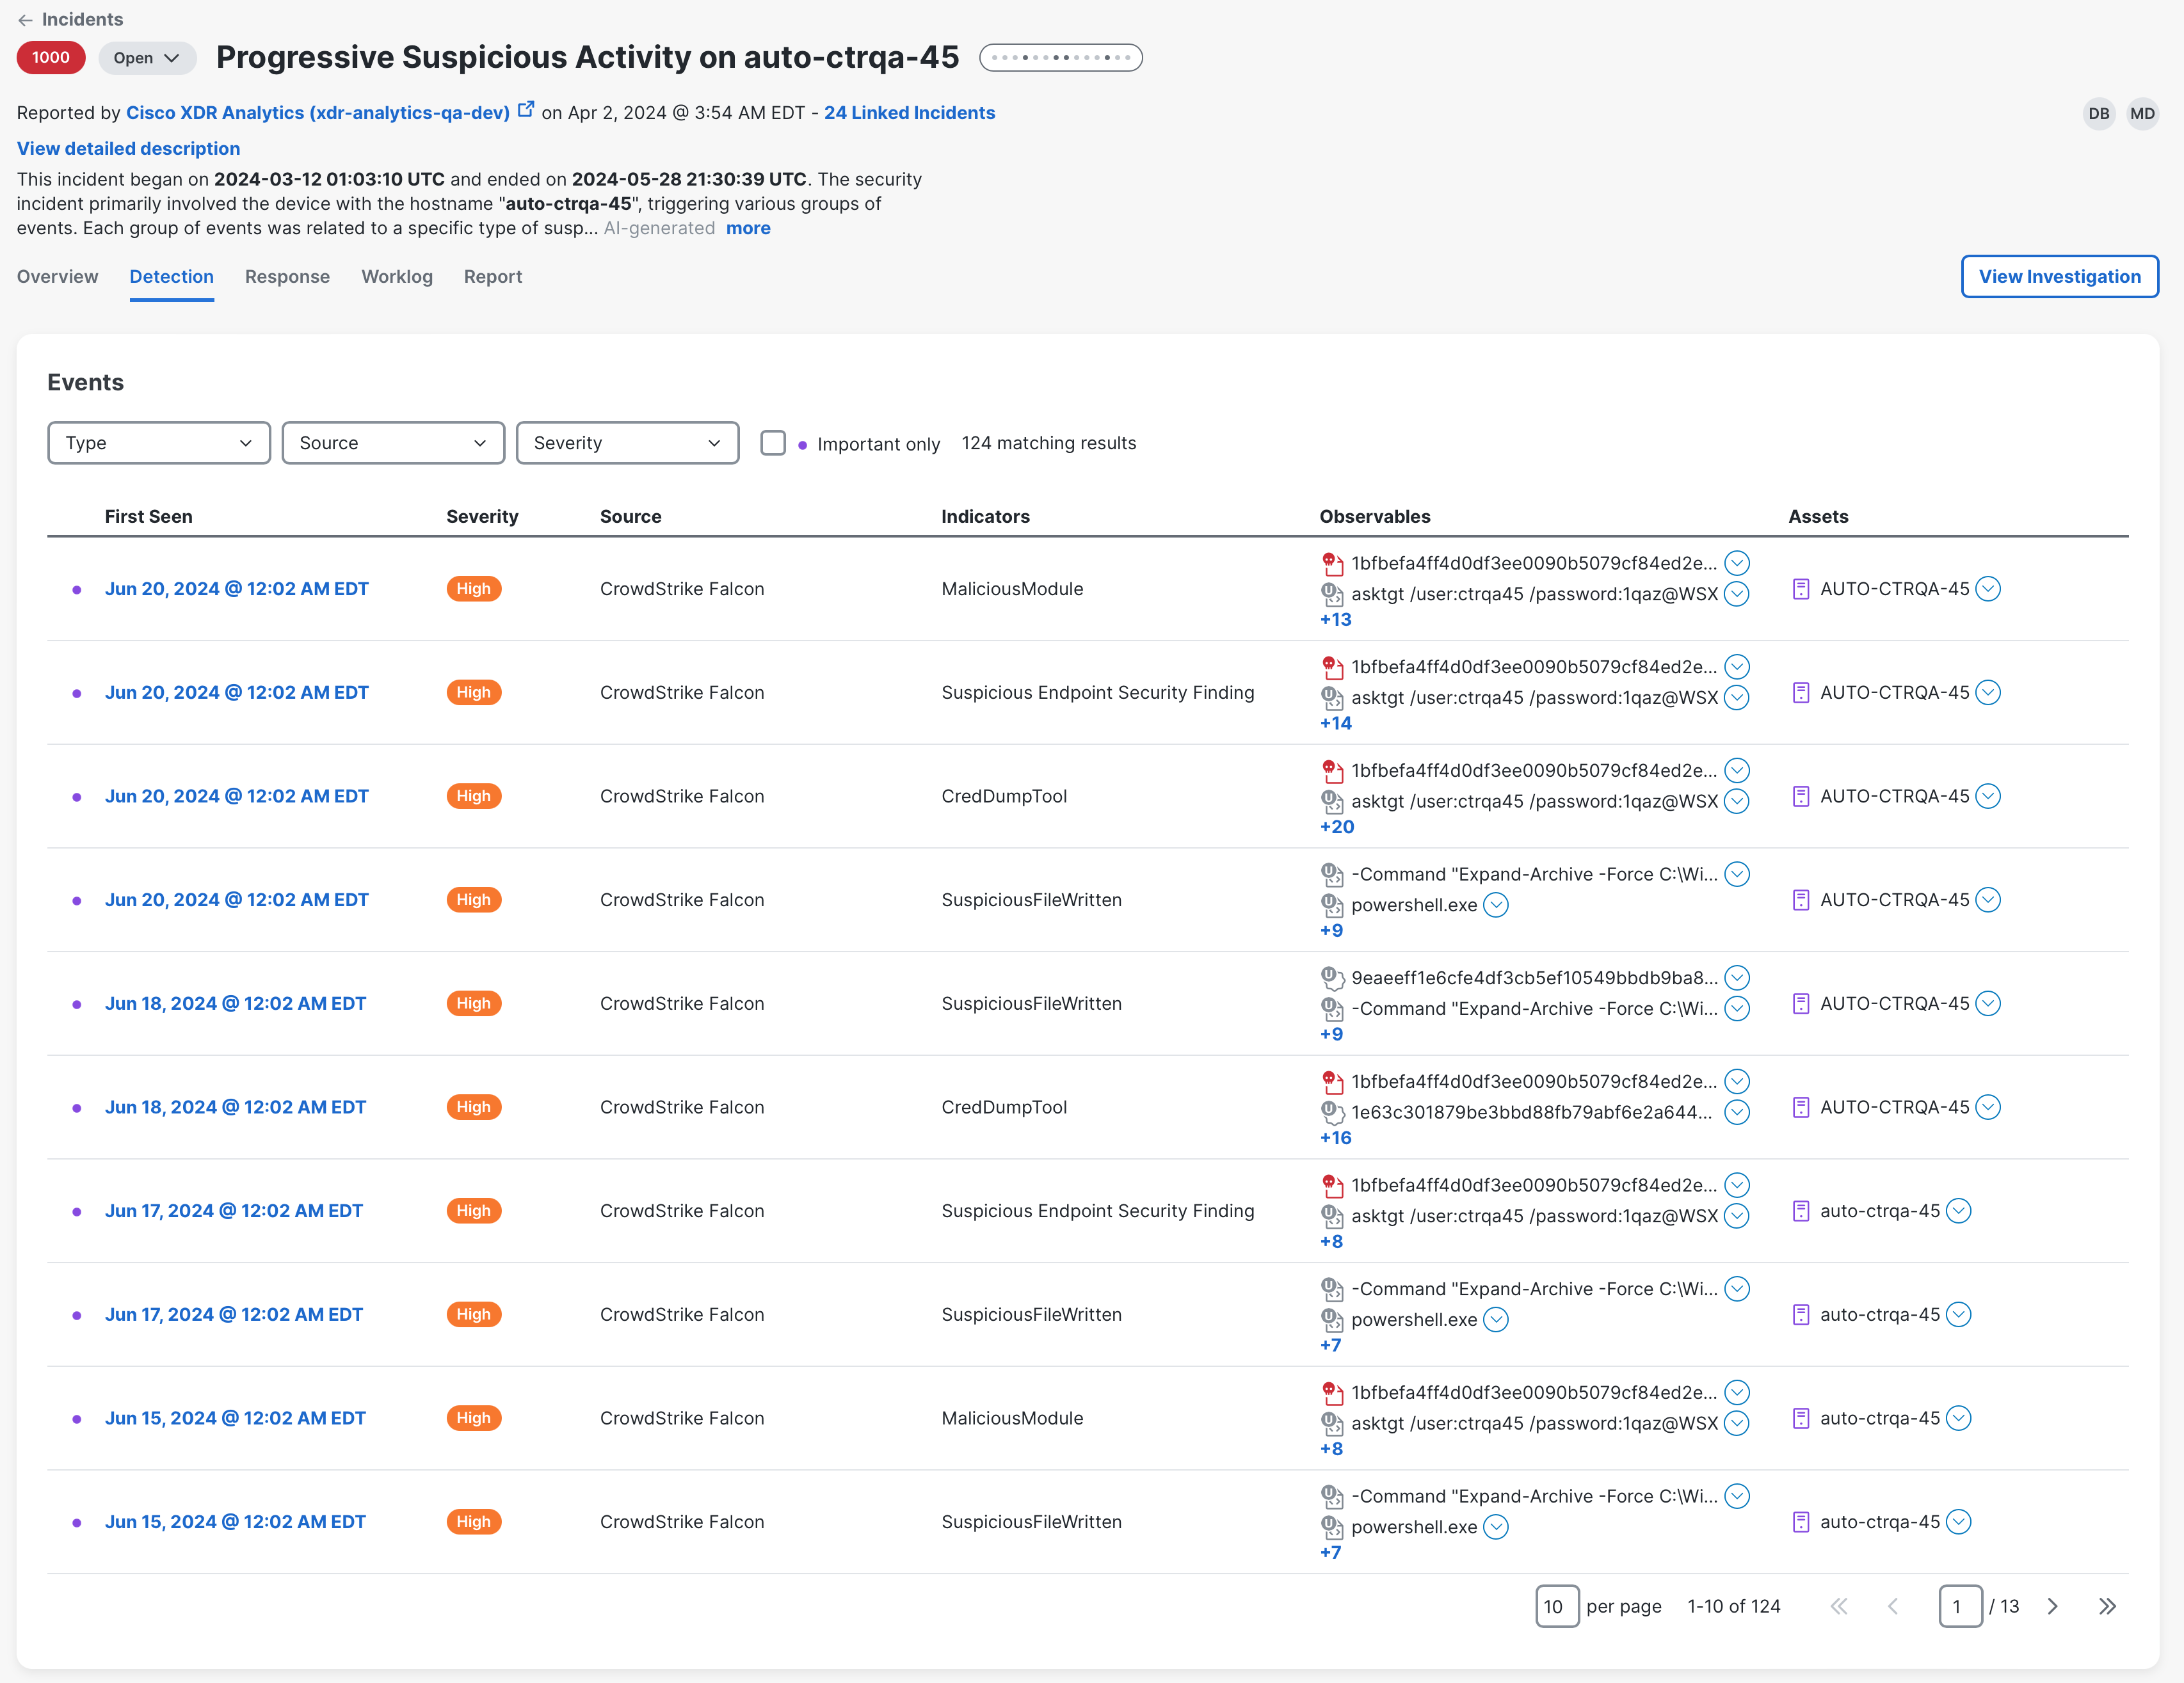
The Detection tab in the incident detail displays data associated with the incident that is derived from events, judgments, and indicators. You can filter the events by type, source, and severity to narrow the list. You can filter the list by specific types, sources, and severity to narrow the list. For more information, see the Detection help topic.
-
Use the Source filter to see all the sources that are providing detections, from Cisco security products to third-party integrations.
-
View the data in each row in the table to gain an understanding of the event that was initially involved with the incident, or events and indicators included in the saved investigations that are linked to the incident.
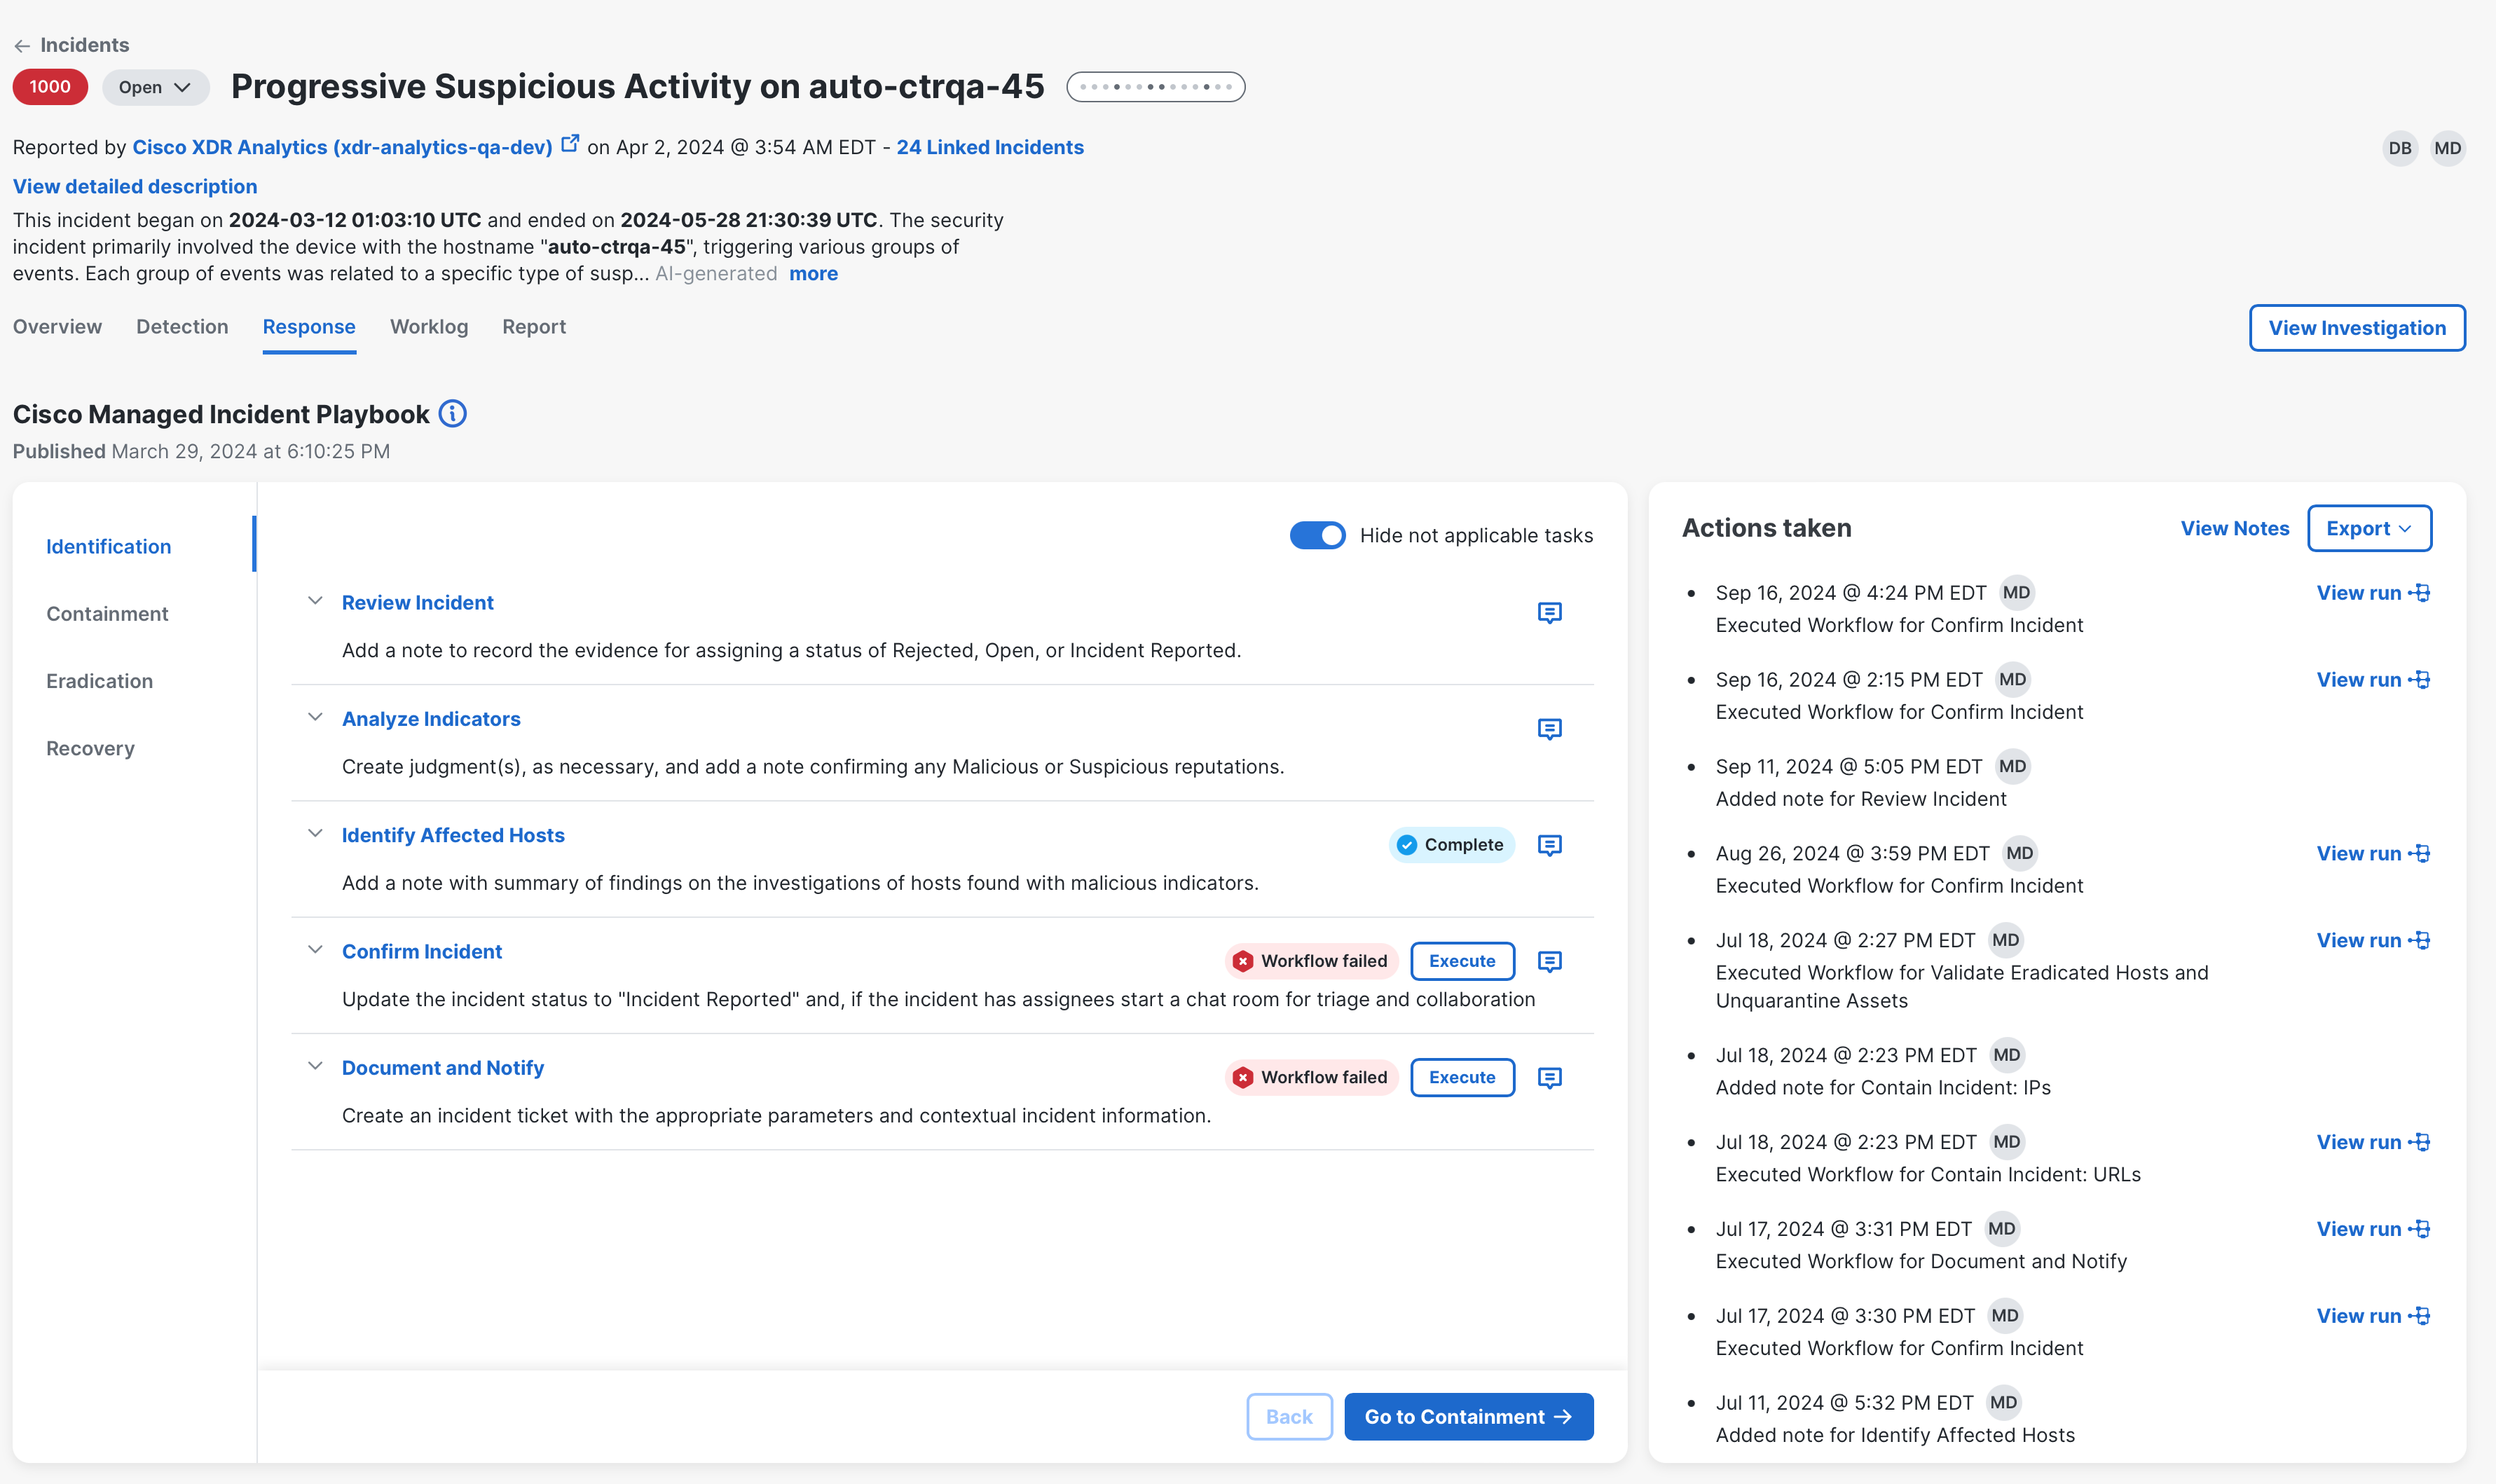
On the Response tab, you have guided tasks that follow the SANS incident response guidelines of Identification, Containment, Eradication, and Recovery. For more information, see the Response.
-
Use the tasks to identify, contain, and eradicate the threat, and then restore systems to recover from the threat.
-
Execute workflows to automate some of the response tasks, such as isolating all the affected assets on your Endpoint Detection and Response solution.
-
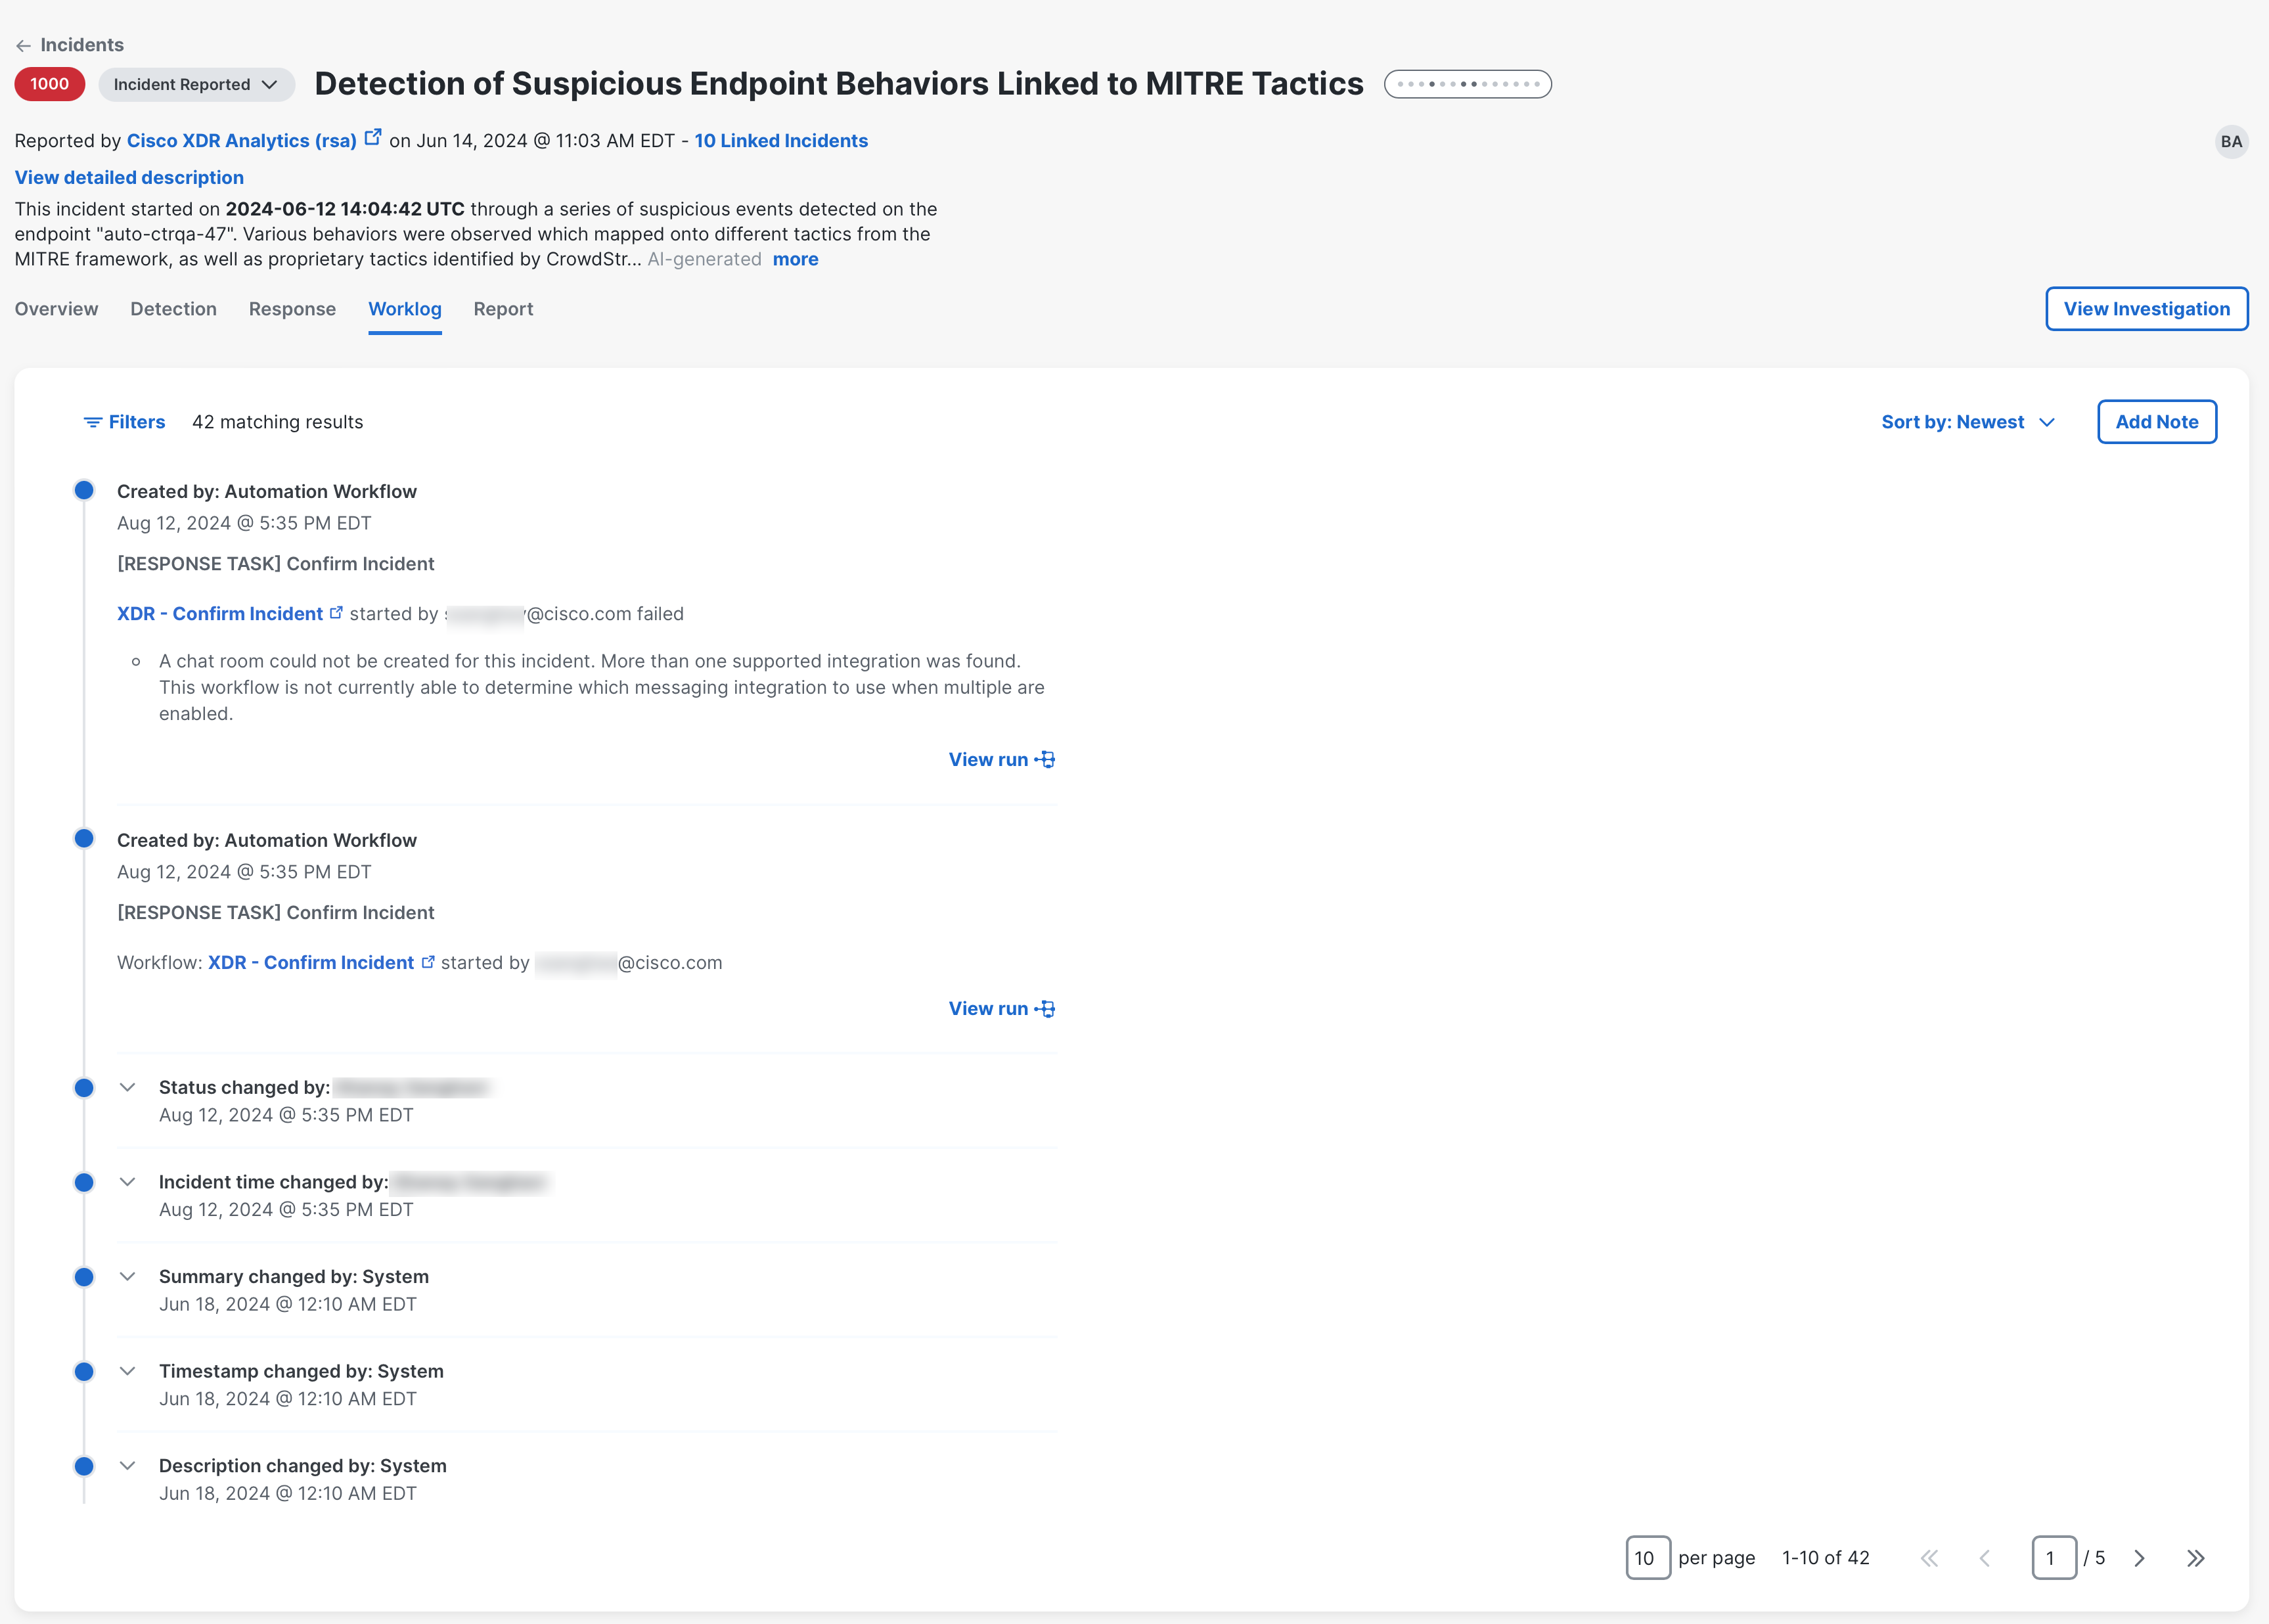
Add notes to document your findings throughout the incident response process.
If your organization has Cisco XDR Advantage or Cisco XDR Premier licensing tier, you can acquire and view forensic data from assets within an incident. For more information, see XDR Forensics.


