Observables
You can quickly start enrichment by searching for observables from the Cisco XDR ribbon using the Find Observables on Page icon or the Enrichment search box. Once observables are identified, you can then add them to the casebook or investigate further on the Investigate page. You can also use the Pivot menu to perform specific tasks in the integrated products.
-
From the Cisco XDR ribbon menu or the Open XDR Ribbon floating button, click the
 or
or  (Find Observables on Page) icon.
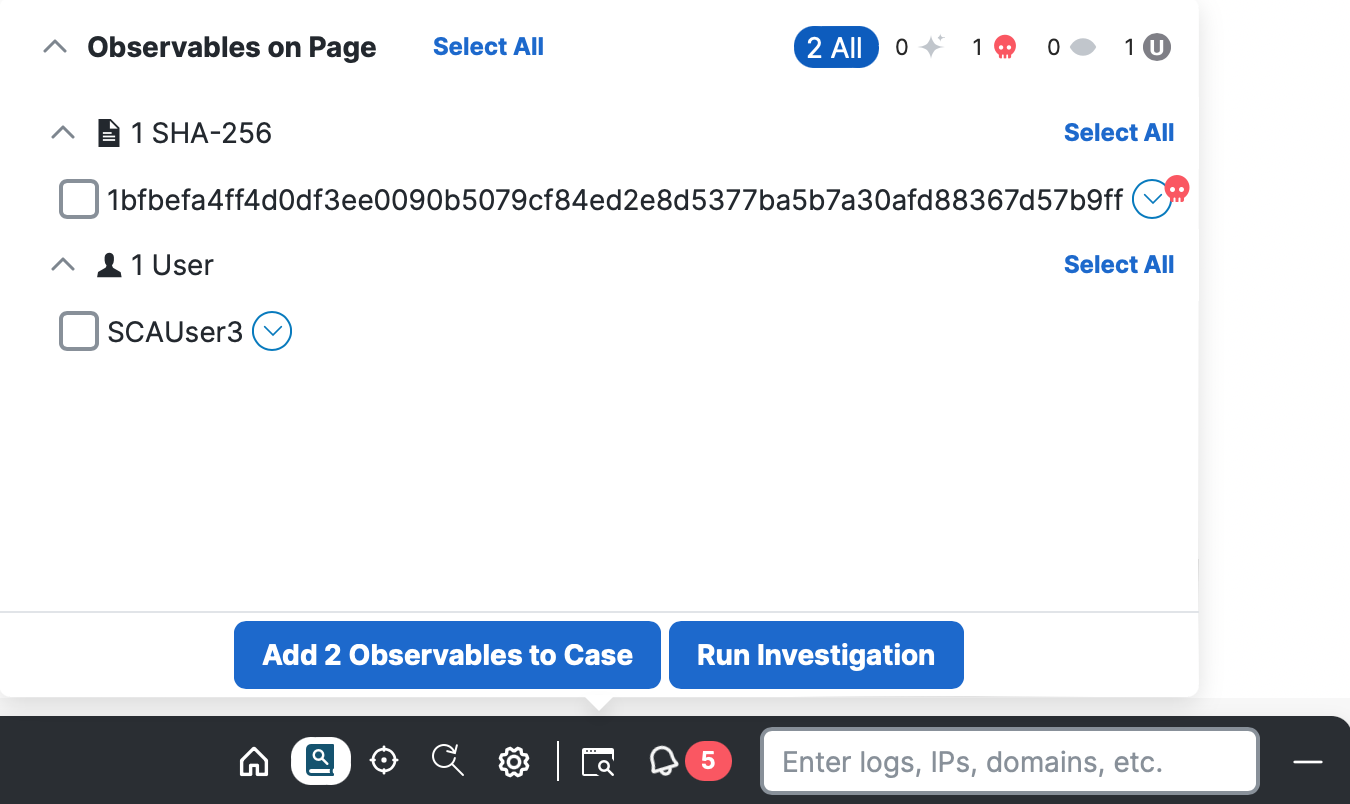
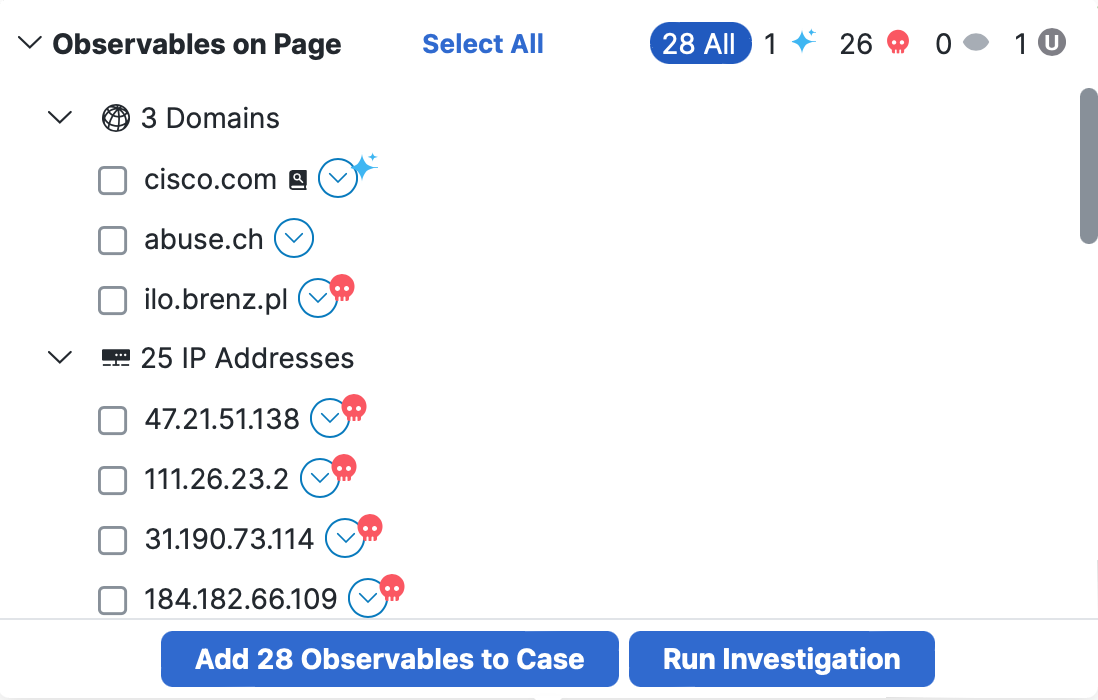
The extracted observables are displayed by observable type on the Observables on Page popup.
-
Optionally, click Clean, Malicious, Suspicious, Unknown, or multiple disposition filters to filter the observables by disposition. See Color and Icon Key for information on the icon and color combinations for dispositions. Click All to clear the applied filters. The All button number indicates the total number of observables found on the page.
-
Check the check box next to the observables or hover over All or a disposition filter and click Select All or Select Filtered to check the check boxes next to all or filtered observables. To check the check boxes next to the observables based on type, hover over the observation type and click Select All or Select Filtered.
-
Click Add Observables to Case or Run Investigation, or use the Pivot menu to perform additional tasks.
-
Enter, or copy and paste the contents of a suspicious IOC (such as email, log message, domain, URL, or incident ticket) into the Enrichment search box in the ribbon menu and press Enter on your keyboard to begin extracting observables.

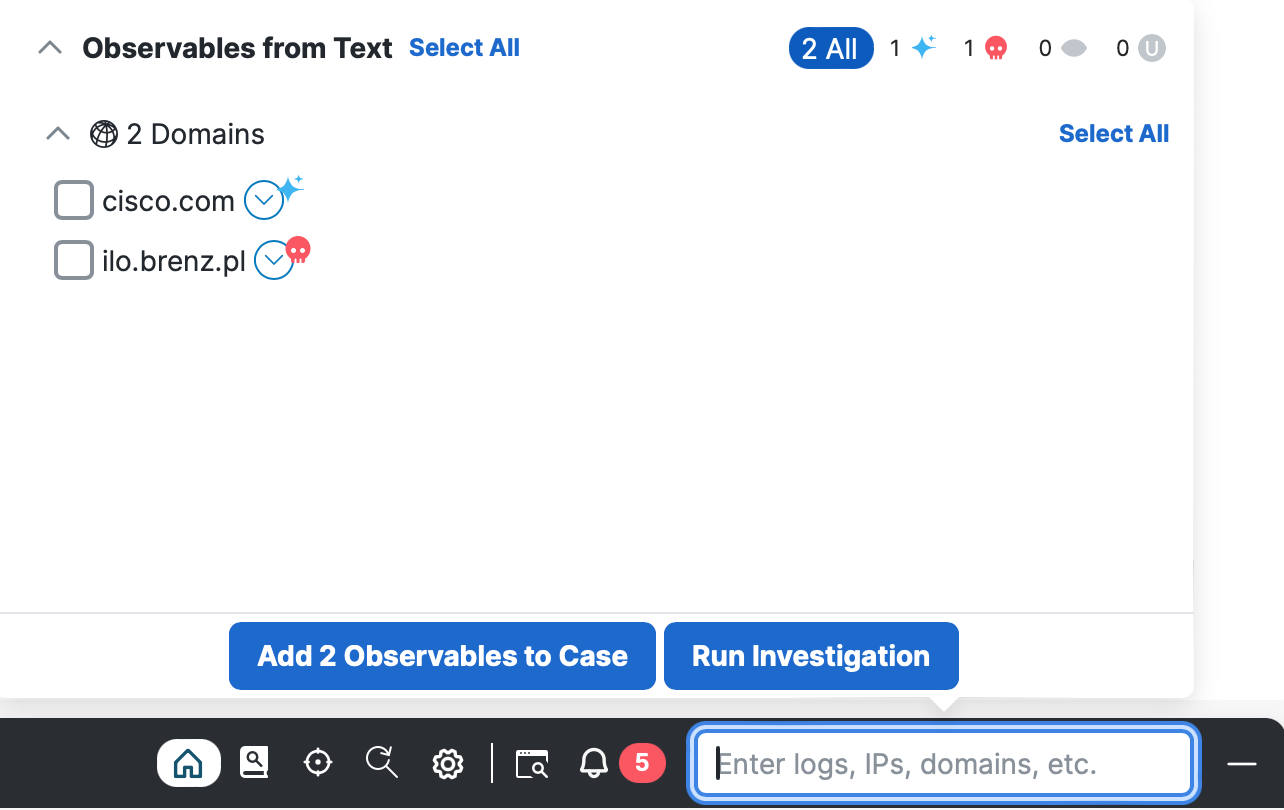
The extracted observables are displayed by observable type on the Observables from Text popup.
-
Optionally, click Clean, Malicious, Suspicious, Unknown, or multiple disposition filters to filter the observables by disposition. Click All to clear the applied filters. The All button number indicates the total number of observables found from text.
-
Check the check box next to the observables or hover over All or a disposition filter and click Select All or Select Filtered to check the check boxes next to all or filtered observables. To check the check boxes next to the observables based on type, hover over the observable type and click Select All or Select Filtered.
-
Click Add Observables to Case or Run Investigation, or use the Pivot menu to perform additional tasks.
When filtering observables by disposition, only those observables are displayed on the Observables on Page or Observables from Text popup.
To filter observables by disposition, click Clean, Malicious, Suspicious, Unknown, or multiple disposition filters. Hover over a disposition filter and click Select Filtered to check the check boxes next to the filtered observables.
Click All to clear the applied filters. Hover over All and click Select All to check the check boxes next to all the observables.
To uncheck all the checked observables, click Deselect All.
You can add the observables to existing cases, the active case, or a new case in the Casebook App.
-
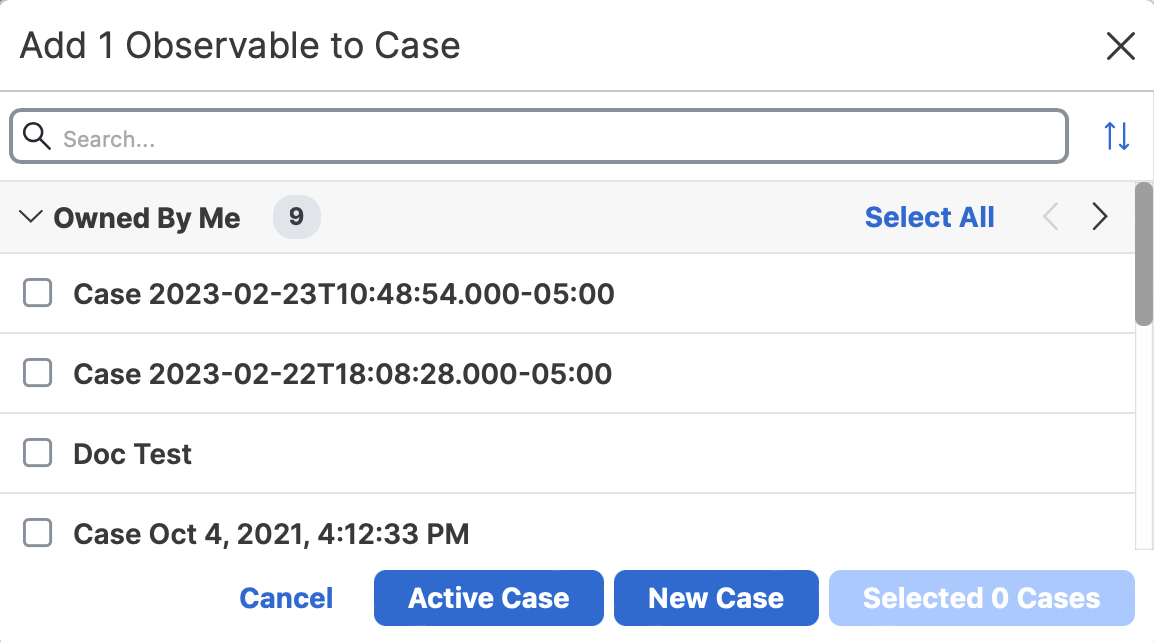
Check the check boxes next to the observables you want to add to the Casebook, and click Add Observables to Case. The Add Observables to Case dialog box opens.
-
Perform one of the following options to add the selected observables:
- Check the check boxes next to the cases and click Selected Cases to add the observables to the selected cases.
- Click Active Case to add the observables to the active case in the casebook.
- Click New Case to create a new case and add the observables to it.
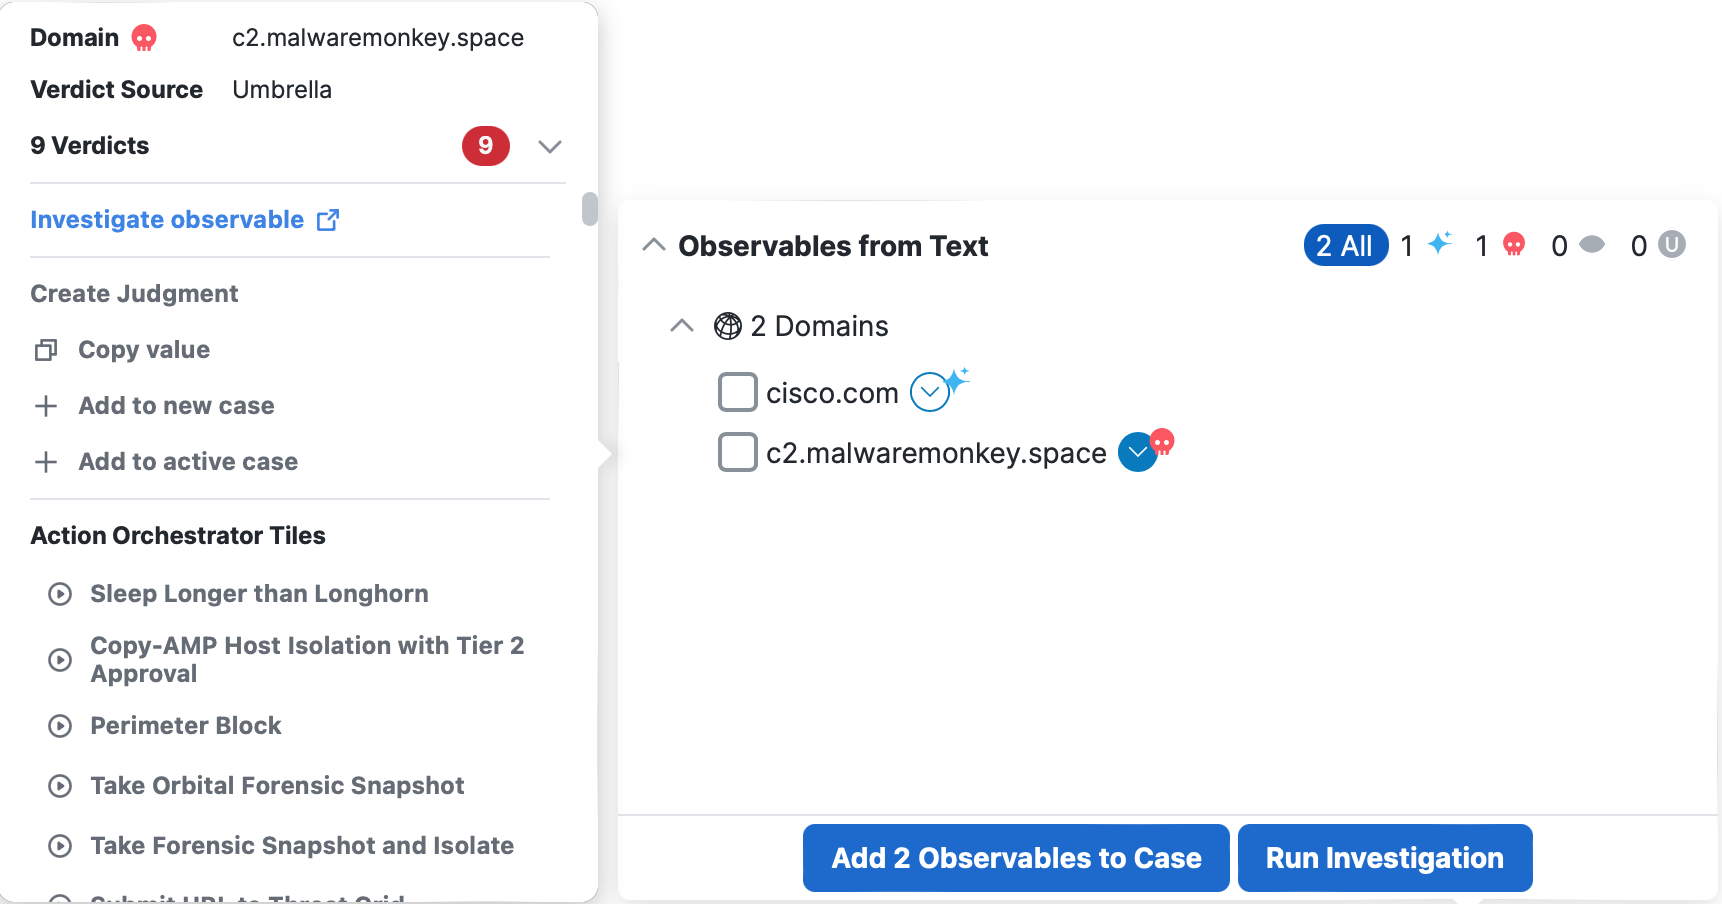
Once an observable has been identified, click Investigate Observable in the Pivot menu to start an investigation of the observable. See Investigate for more information.
You can also use the Pivot menu on the observable to perform additional tasks, such as block a malicious domain or pivot into integrated products to browse or search for it. For details, see Pivot Menu.
