Detection
The Detection tab in the incident detail with AI analysis displays a list of detection groups associated with the incident that are derived from individual detections analyzed by agentic AI.
Detections generated by integrated products are analyzed by agentic AI in Cisco XDR to determine the relationships between detections, such as shared observables, overlapping timelines, and related attack patterns. When events are determined to be part of the same threat, they are grouped to create incidents in Cisco XDR. The resulting data is displayed in the Detection tab. For details, see Detections.
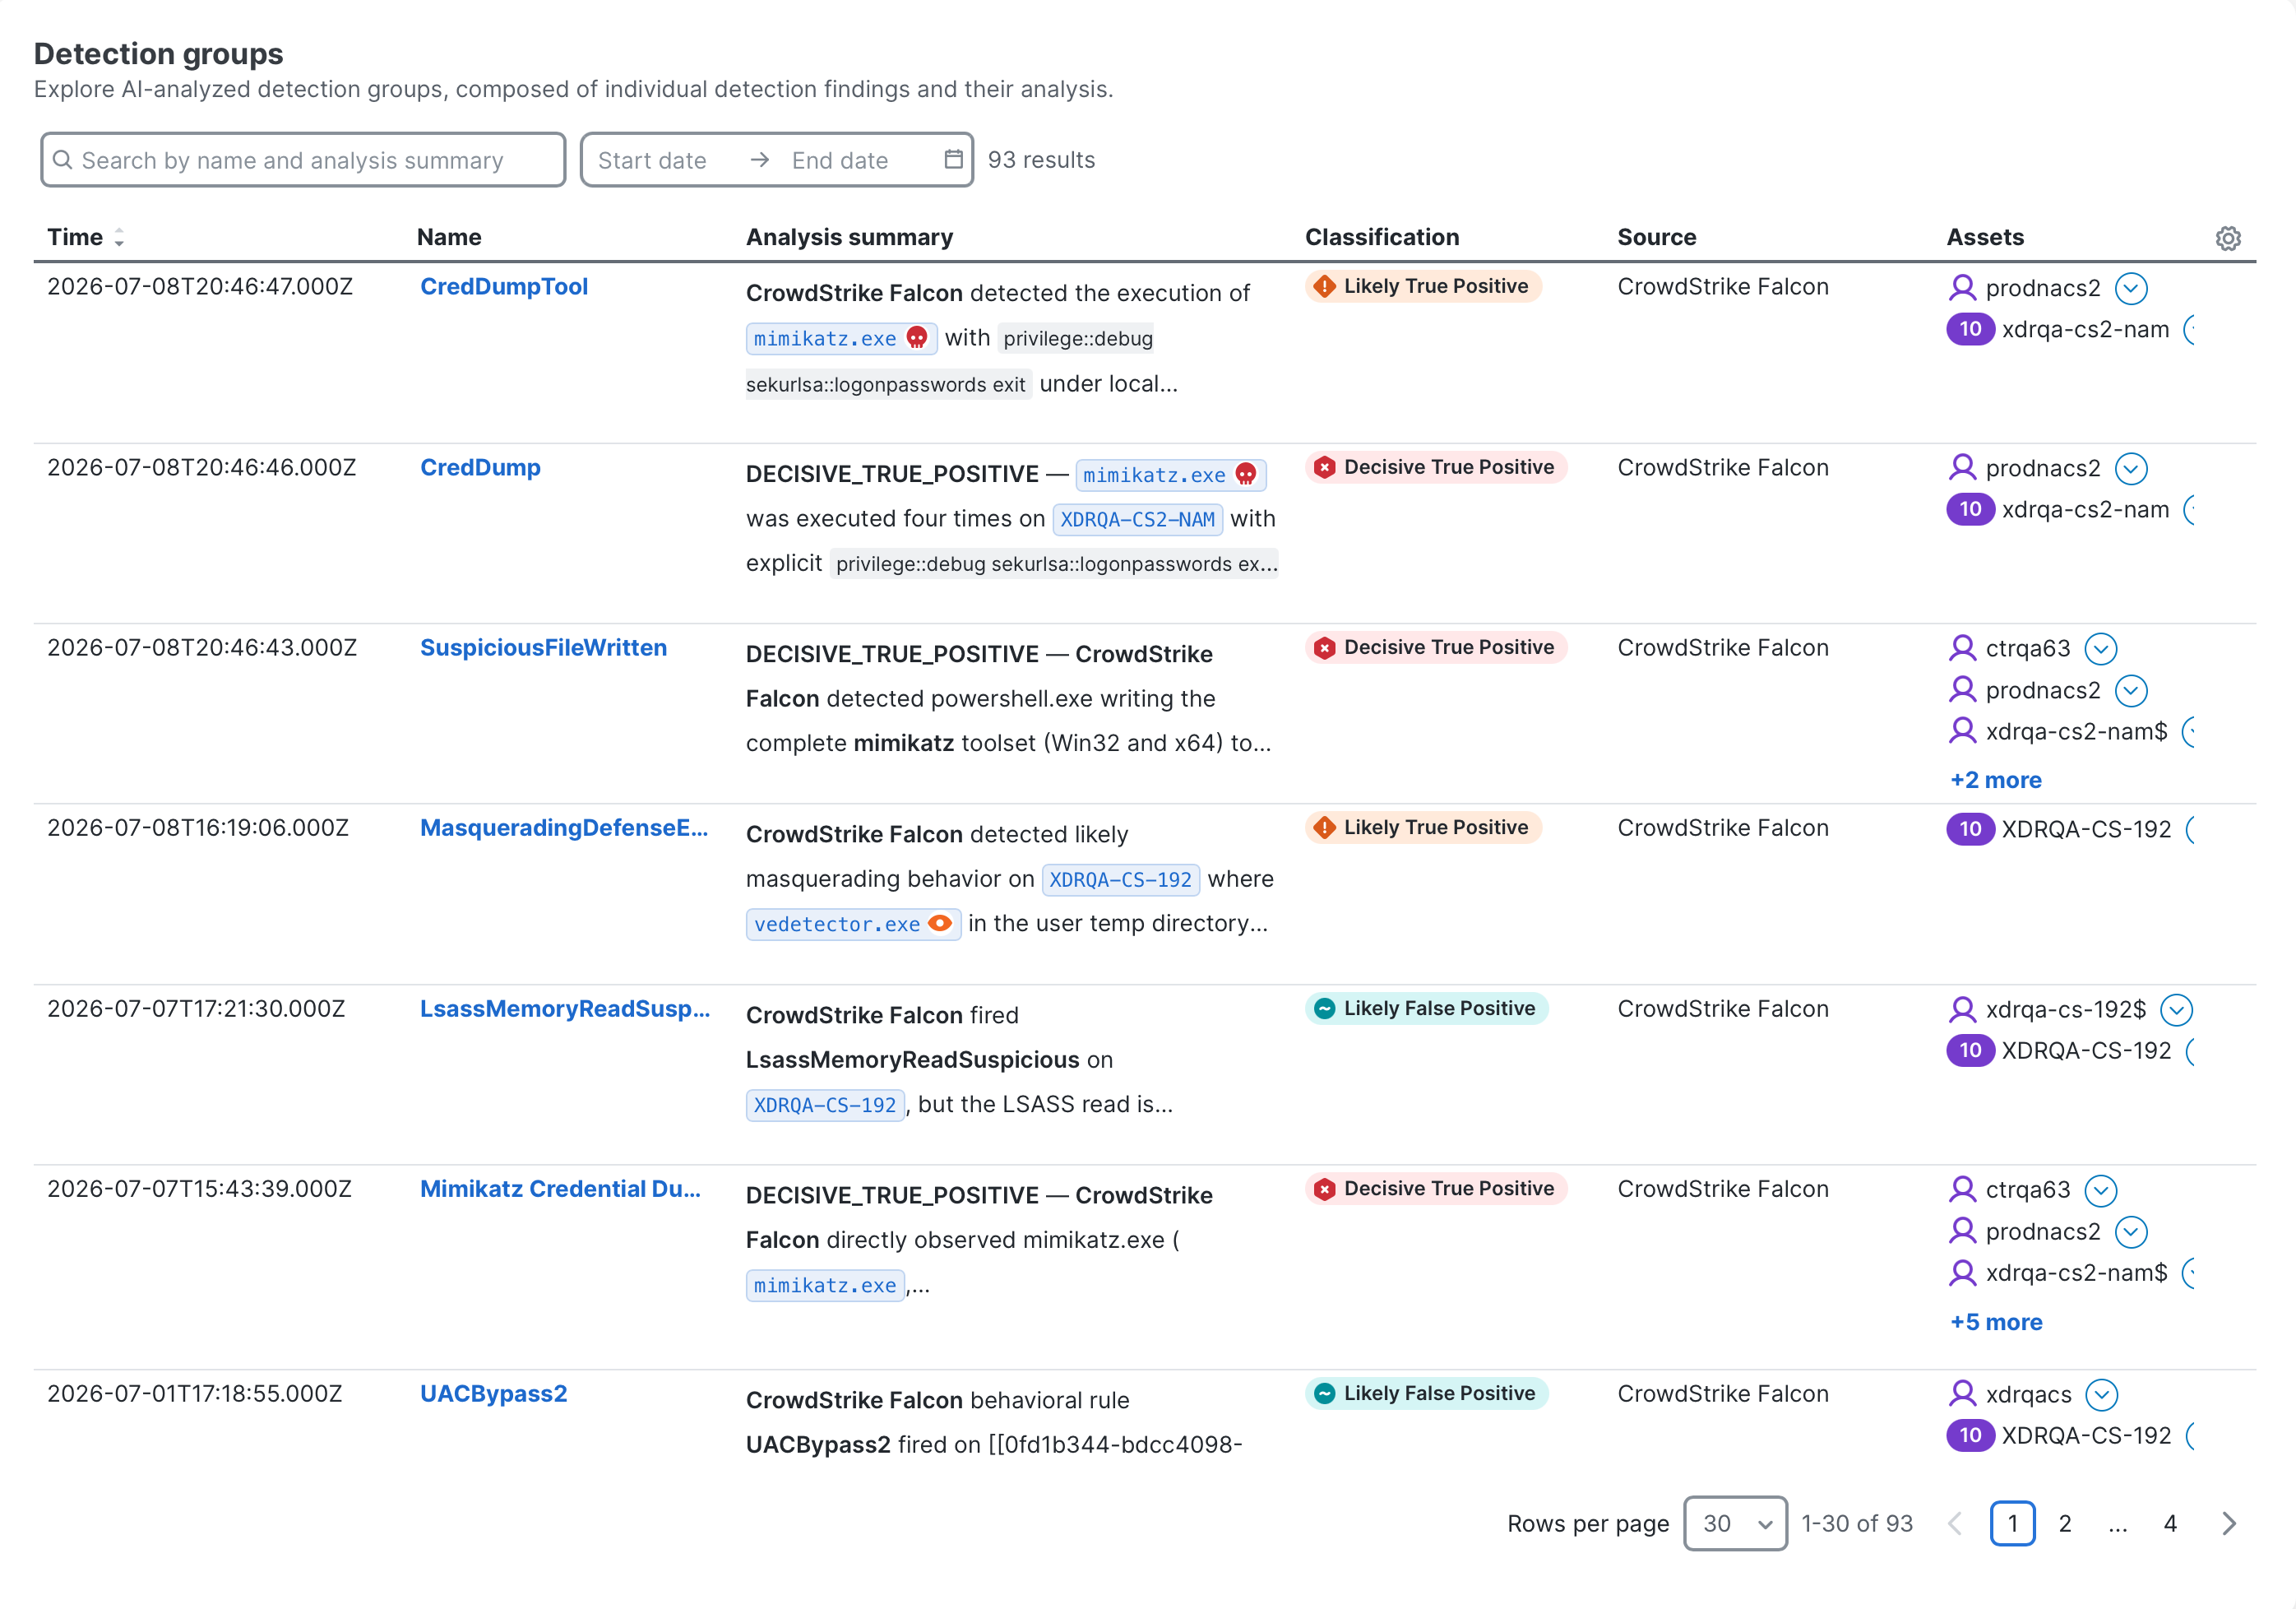
Each row in the table includes data from a group of detections that were initially involved with the incident.
 Detections Table Column Descriptions
|
Column Name |
Description |
|---|---|
| Time |
Date and time of the first detection observed within the detection group. The detections are sorted by timestamp. Use the |
| Name |
Name of the detection group defined by the source. Click the detection group name to open the detection details in a drawer. For details, see View Detection Details in Drawer. |
| Analysis summary |
A summary of the detection analysis by agentic AI for the current detection group. You can click an observable name in the summary to open the observable drawer for details on the observable. For more information, see Observable Drawer. |
| Classification |
The detection classification tag is determined by analyzing individual security events and their classifications. The confidence tag indicates the overall confidence of the detection classification (High confidence, Medium confidence, or Low confidence) based on specific factors. For details, see Detection. |
| Source |
Cisco XDR integration or source that produced the group of detections. |
| Assets |
The assets that were targeted in the group of detections; where the displayed asset values are based on strong identifier types. The assets are color-coded based the asset type. Click the |
| Observables |
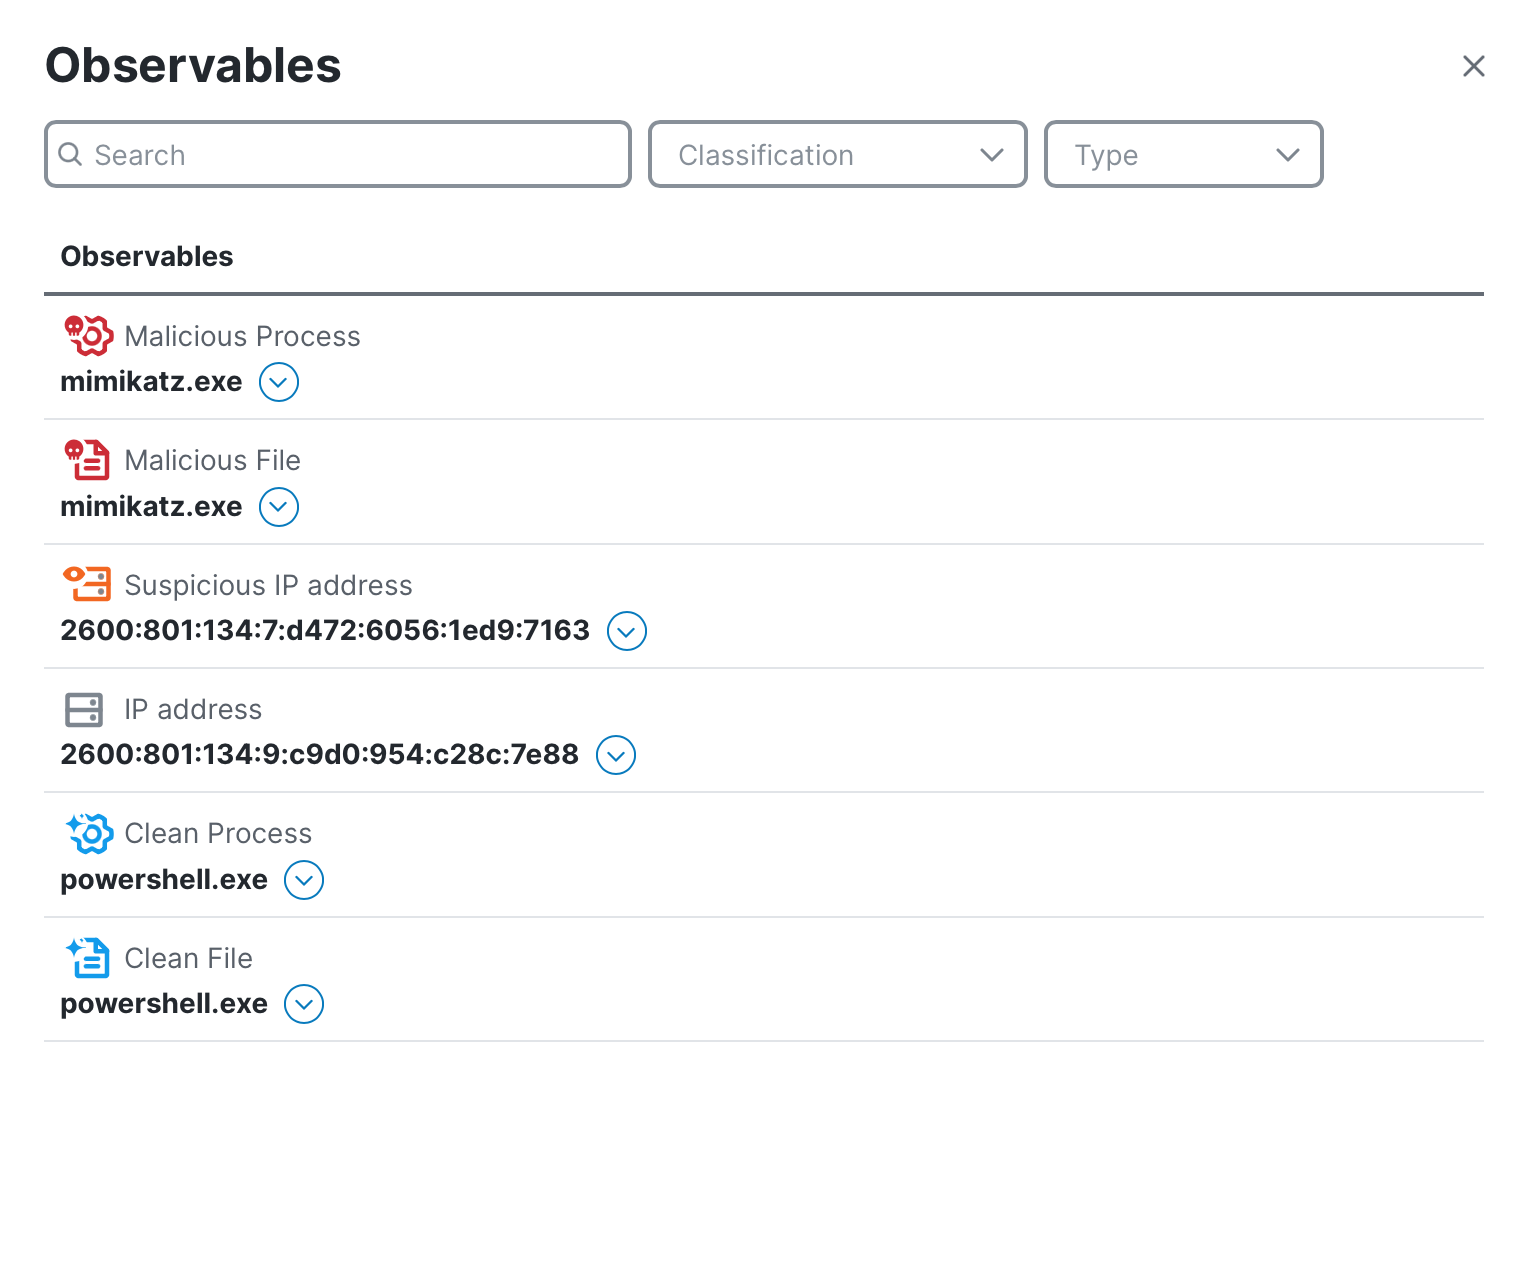
The first three observables in the group of detections and dispositions of the observables taken from verdicts. The observables are color-coded and sorted based on the disposition. If more than three observables were seen in the detection group, the number of additional observables is displayed in the + more link beneath the list. Click the + more link to open the Observables drawer and view all the observables seen in the detection. Use the Search bar in the upper portion of the drawer to quickly search the list of observables and use the Classification or Type drop-down list and check the check boxes next to the observable classification or observable type values to narrow the display based on classification or observable type. If you do not choose a classification or type, all observables with all classifications and observable types are displayed in the list. Click the
Click the |
| MITRE tactics |
List of MITRE ATT&CK tactics used by the detections within the detection group. If more than three tactics were used, the number of additional tactics is displayed in the + more link beneath the list. Click the + more link to open the MITRE tactics drawer and view the complete list of tactics used. You can also use the Search bar in the upper portion of the drawer to quickly search the list of tactics. |
| MITRE techniques |
List of MITRE ATT&CK techniques used by the detections within the detection group. If more than three techniques were used, the number of additional techniques is displayed in the + more link beneath the list. Click the + more link to open the MITRE techniques drawer and view the complete list of techniques used. You can also use the Search bar in the upper portion of the drawer to quickly search the list of techniques. |
 (Sort) icon in the column heading to sort from oldest to newest (ascending) or newest to oldest (descending).
 (Pivot Menu) icon next to the observable name to view the disposition, observable type, and verdicts associated with the observable, and perform additional tasks. See the
  (Clear) icon to remove your selections.
 Search and Filter Detection Groups
By default, all the detection groups are listed in the Detections tab. You can search and filter the detection groups to narrow the display to only those detection groups you want to view.
Search Detection Groups
Enter the search criteria in the Search field to search for detections by name and analysis summary. Search entries are not case sensitive. The detection groups that match your search criteria are displayed in the list of detection groups.
Filter Detection Groups by Date Range
By default, all the detection groups are listed in the Detections tab. You can narrow the display of detection groups based on a specific timeframe using the Start date and End date drop-down calendars.
Reorder and Customize Columns
You can reorder the columns in the table and select the columns displayed to customize the table for the data you want to view.
Reorder Columns
To reorder the table columns, click and drag a column header to the desired position in the table.
Customize Columns
Click the  (Settings) to open the Display Settings drawer and check the check boxes next to the columns you want displayed in the detections table. If custom columns are displayed, click Reset to defaults to reset the table column settings to its default values.
View Detection Details in Drawer
When you click a detection group name in the list, the detection group drawer opens where you can quickly view the analysis summary, including the incident classification, MITRE ATT&CK® tactics and techniques used by the detections within the detection group, targeted assets, observables, and the individual detections within the detection group in the Detections area.
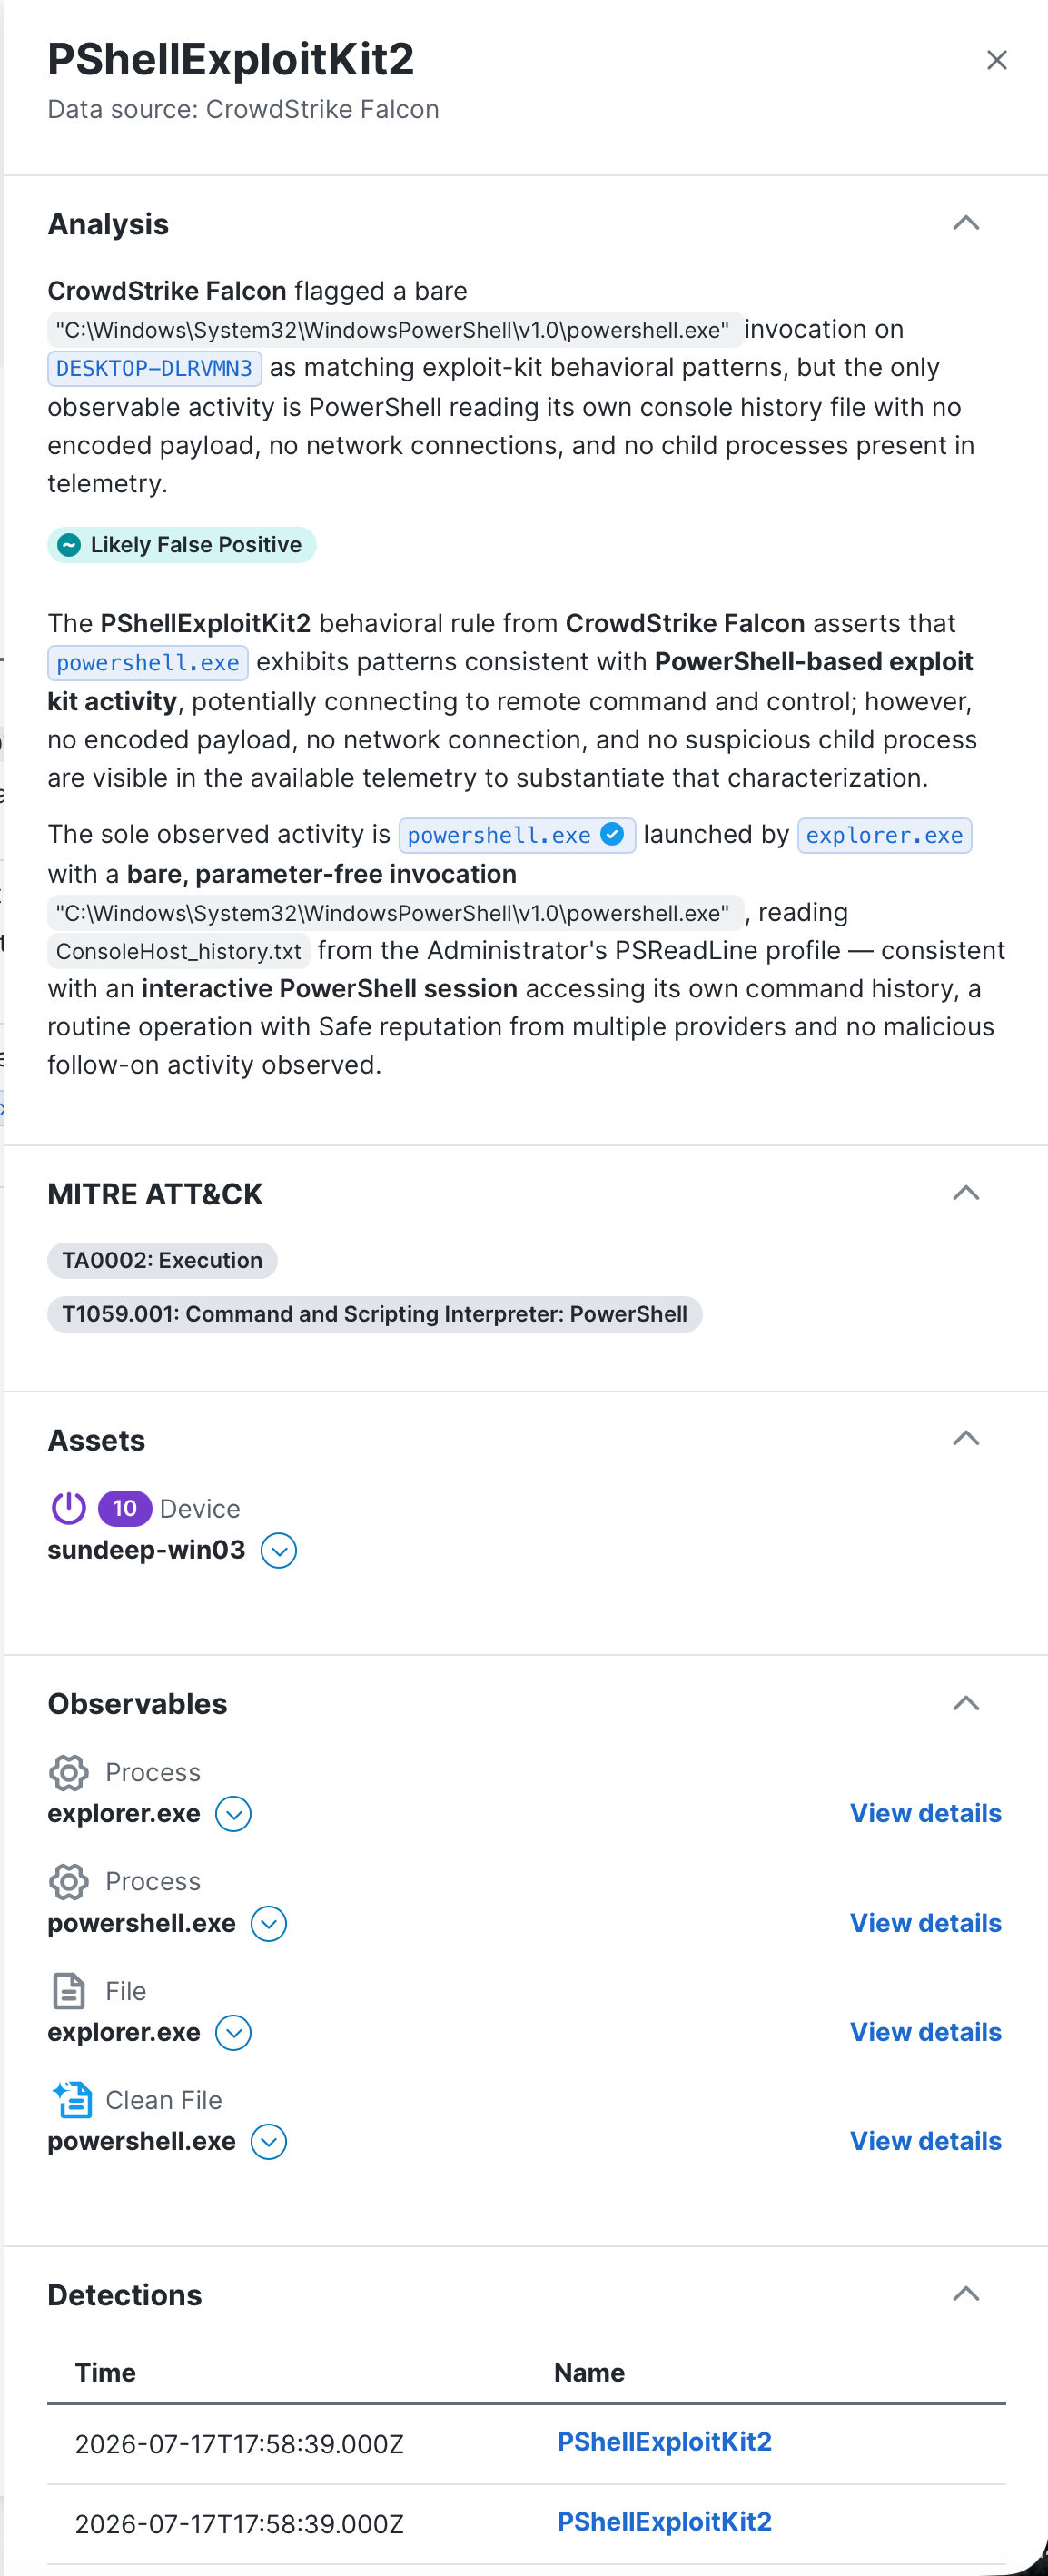
You can click an observable name in the summary or click View details in the Observables panel to open the observable drawer for more information on the observable. For details, see Observable Drawer. Click a detection name link in the Detections table to open the detection details page that lists the detection details, such as a source product, associated MITRE ATT&CK® tactics and techniques, related activities for the detection, and the activity in JSON format. For more information, see View Detection Details.