Dashboard and Card Settings
On the Dashboards page, the dashboards and cards have settings that allow you to customize the dashboard and card views.
To maximize the dashboard to full screen, click Enter Full screen mode in the top right corner of the Dashboards page; click the ![]() (Exit Full screen mode) icon in the upper corner or press the Esc key on the keyboard to collapse the dashboard to normal view.
(Exit Full screen mode) icon in the upper corner or press the Esc key on the keyboard to collapse the dashboard to normal view.
By default, the Stay logged in toggle is enabled, indicating that you will not be logged out of the current Cisco XDR session while the dashboard is maximized to full screen. If you disable the setting or exit the full screen mode, you will be logged out of the current Cisco XDR session automatically after 24 hours.
Note: When the Stay logged in toggle is enabled, it applies to the full screen dashboard in the current browser tab only. If the same session of Cisco XDR is opened in another browser tab in normal view, you will be logged out of that session automatically after 24 hours.
Note: Ensure that the host computer is configured to never sleep. Otherwise, the network requests will fail and an error message is displayed.
Specify Scroll Option
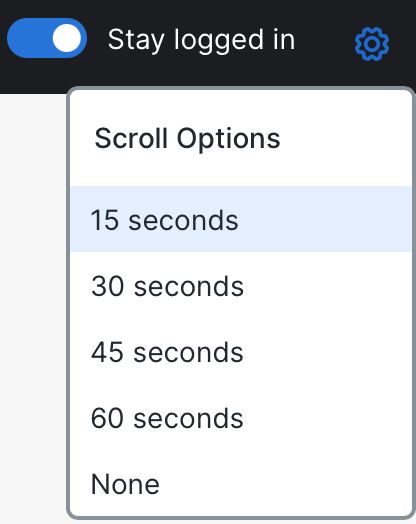
On the full screen dashboard, click the ![]() (Scroll Options) icon and choose the rate at which the dashboard automatically scrolls up and down when left untouched in full screen mode. If you choose the None option, the dashboard will not scroll up and down automatically.
(Scroll Options) icon and choose the rate at which the dashboard automatically scrolls up and down when left untouched in full screen mode. If you choose the None option, the dashboard will not scroll up and down automatically.

On the dashboard, you can specify a global time period for the data that is displayed in the cards, or specify a timeframe on each individual card.
-
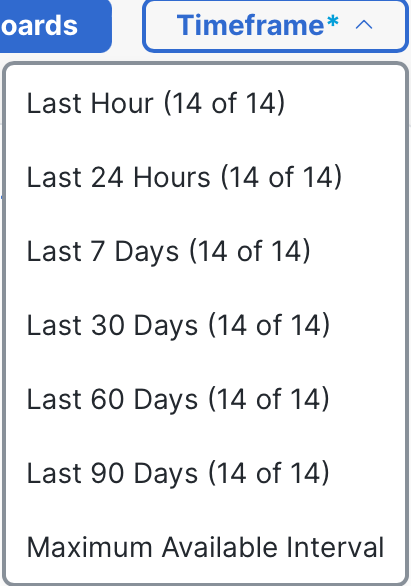
Click Timeframe in the upper right corner of the Dashboards page and choose the global time period for the data that is displayed in the cards (for example, Last 24 hours). If you choose the Maximum Available Interval option, the cards display data from the longest time period that is available.

-
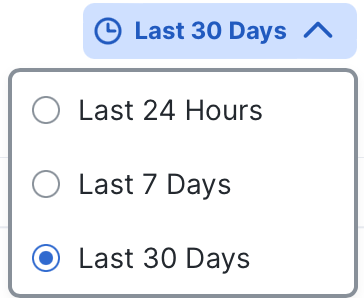
Click the timeframe drop-down list in a dashboard card to choose the time period for the data that is displayed in the card only.

Note: The global Timeframe values may not contain the same timeframe values available in the dashboard cards. If you select a global timeframe that is not available in the card timeframe, the card timeframe will remain unchanged.
You can resize the cards and move them to any position on the dashboard. To resize a card, click the ![]() (Resize) icon in the lower right corner and drag it to the desired size.
(Resize) icon in the lower right corner and drag it to the desired size.
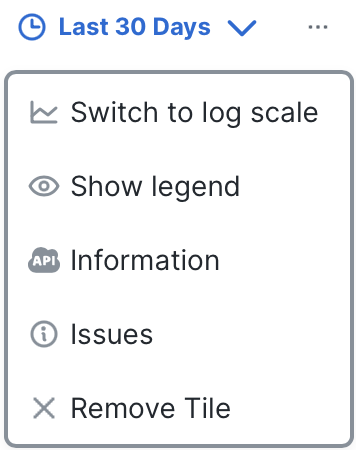
Click the ![]() (Ellipsis) icon to open the Options menu in the upper right corner of the card to switch between log scale and linear scale, show or hide legends, view information, or remove the card.
(Ellipsis) icon to open the Options menu in the upper right corner of the card to switch between log scale and linear scale, show or hide legends, view information, or remove the card.

- Switch to log scale or Switch to linear scale - Choose this option to toggle between displaying the data in log scale or linear scale in the card (for chart cards only).
- Hide legend or Show legend - Choose this option to toggle between displaying the chart legend or hiding the legend in the card (for chart cards only). By default, the legend is hidden.
- View API information - Choose this option to open a dialog box and view more details such as history, issues that have been detected, and API information. In the dialog, click Copy Debug Information to copy the following information to your clipboard: host, user, organization, integration instance, card definition, and API response. The copied debug information is useful to include when you submit feedback or open a case with Cisco Support.
- Remove - Choose this option to remove the card from the currently selected dashboard.
- Refresh - Choose this option to refresh the card data.
- Expand or Collapse - Choose Expand to maximize a card to full screen and enhance visibility into the details. If expanded, choose Collapse to collapse the card to normal size.
Note: For information about the specific cards, see Default Cards and Integration Cards.
Hover in the upper left corner of the card and click the (Grabber) icon. You can then drag the card to the desired location on the Dashboards page.