Default Cards
The Private Intelligence, Automation, Secure Client, and Secure Cloud Analytics cards are automatically available for you to add to your dashboard on the Dashboards page. You do not need to add the integrations to access the cards. However, to generate additional incidents, we recommend that you configure integrations to provide endpoint data, such as Secure Endpoint and Umbrella. For details on how to configure integrations, see Integrations.
The following Private Intelligence cards are available to all users in the Customize Dashboards dialog box:
The Team Mean Time To Contain card displays the average time the status of the incidents initially changed from any of the New statuses to the Open: Contained status within the current organization during the selected timeframe. The New status only includes incidents that were created by a system during the selected timeframe. This allows you to quickly see the average time it took for your organization to effectively contain a new incident. It also displays the increased or decreased time from the previous day, week, or month, depending on the selected timeframe. For details on incident statuses, see Available Statuses.
The Team Mean Time To Resolve card displays the average time the status of the incidents that last changed from any of the Open statuses to any of the Closed statuses within the current organization during the selected timeframe. An Open status only includes incidents that were opened by users during the selected timeframe. This allows you to quickly see the average time it took for your organization to open and resolve incidents. It also displays the increased or decreased time from the previous day, week, or month, depending on the selected timeframe. For details on incident statuses, see Available Statuses.
The Marked as false positive card displays the percentage of incidents that were manually set to the Closed: False Positive status by users out of the total number of incidents set to any of the Closed statuses within the selected timeframe. It also displays the increased or decreased number of incidents from the previous day, week, or month, depending on the selected timeframe.
The Team Mean Time To Engage card displays the average time the status of the incidents initially changed from the New: Presented status to any of the Open statuses within the current organization during the selected timeframe. This allows you to quickly see the average time it took for your organization to start investigating a new incident. It also displays the increased or decreased time from the previous day, week, or month, depending on the selected timeframe. For details on incident statuses, see Available Statuses.
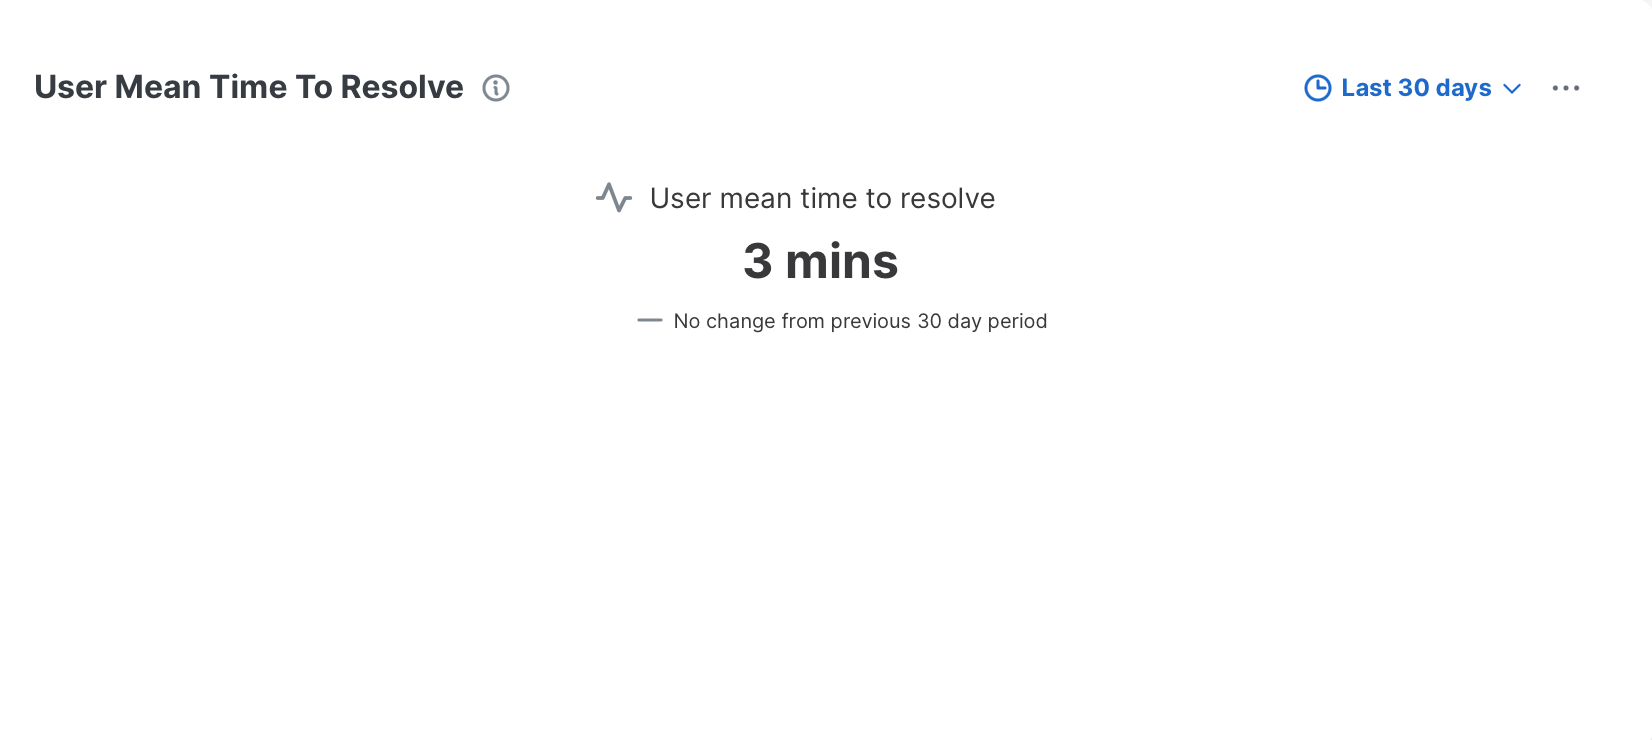
The User Mean Time To Resolve card displays the average time the status of the incidents that last changed from any of the Open statuses to any of the Closed statuses by you within the selected timeframe. An Open status only includes incidents that were opened by you during the selected timeframe. This allows you to quickly see the average time it took for you to open and resolve incidents. It also displays the increased or decreased time from the previous day, week, or month, depending on the selected timeframe. For details on incident statuses, see Available Statuses.
The Unassigned Incidents card displays a list of incidents that have not been assigned to a user over a selected timeframe, organized by the color-coded priority score assigned to the incidents. The priority score is calculated from detection risk (including incident severity and TTP-based risk of financial loss) and asset value at risk (based on the value of assets involved in the incident). Click the name of the incident to view more information on the Incident Detail page.
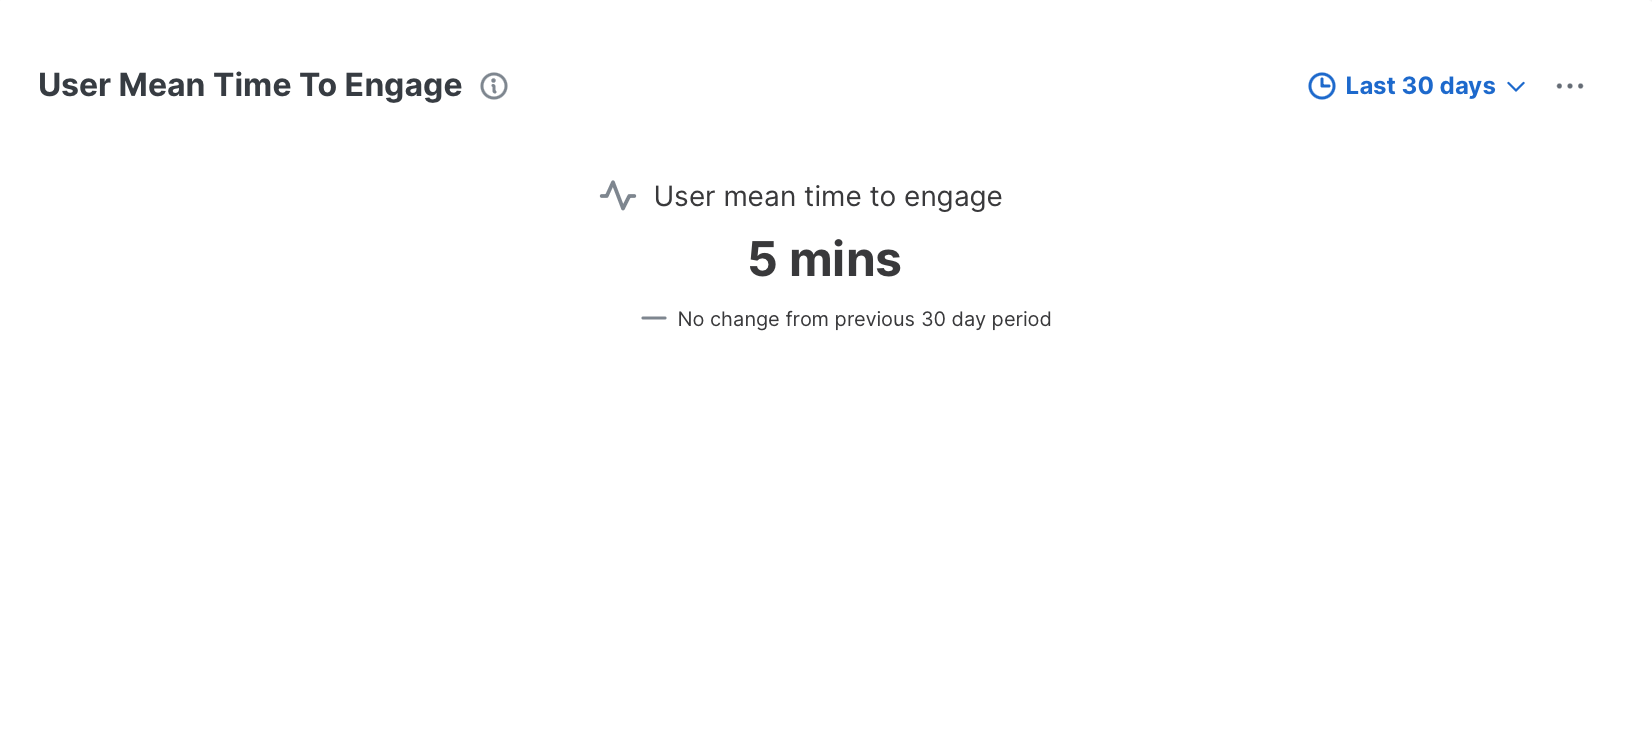
The User Mean Time To Engage card displays the average time the status of the incidents initially changed from the New: Presented status to any of the Open statuses by you within the selected timeframe. This allows you to quickly see the average time it took for you to start investigating a new incident. It also displays the increased or decreased time from the previous day, week, or month, depending on the selected timeframe. For details on incident statuses, see Available Statuses.
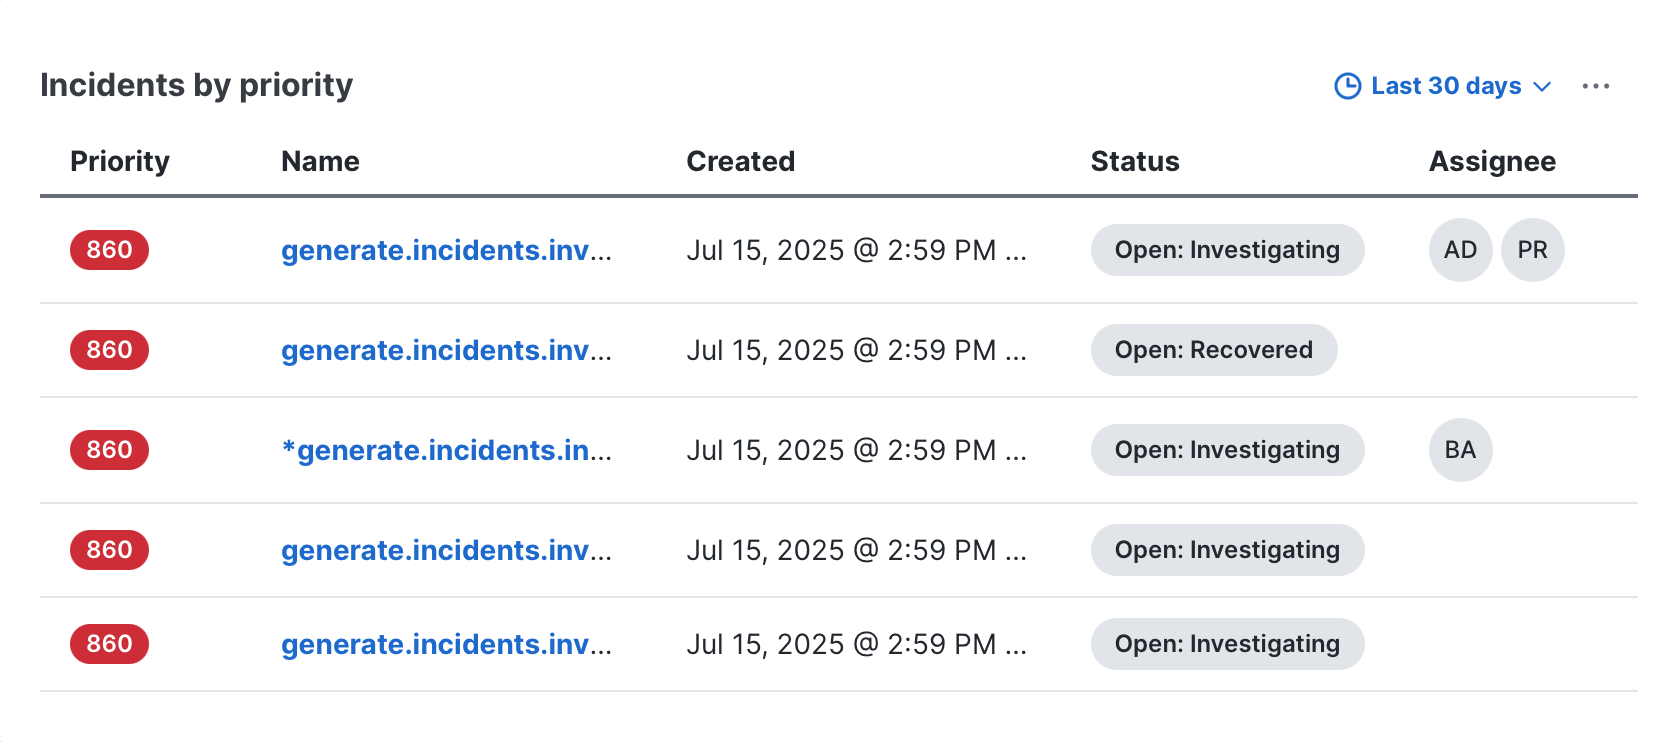
The Incidents by priority card displays all the incidents that have a priority score of 800 or above. Incidents with any closed status are excluded from the list. Each incident displays the name, when it was created, its status, and to whom its assigned. Click the name of the incident to view more information in the incident detail. This allows you to quickly see which incidents need immediate attention.
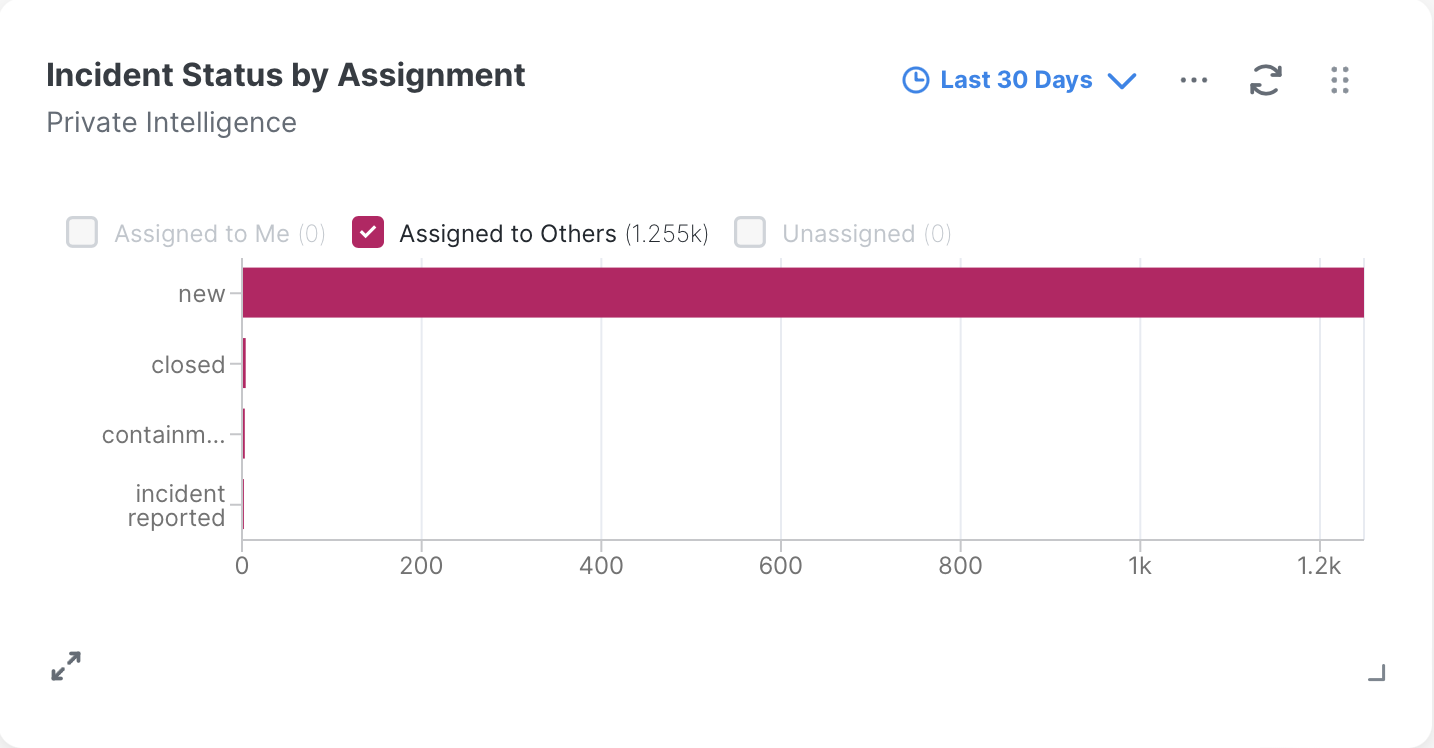
The Incident Status by Assignment card displays incidents that are assigned to you and others, based on the incident status, within the selected timeframe. When you hover over the status bar graph, it displays the total number of incidents, the number of incidents assigned to you, and the number of incidents assigned to other users within your organization. Using this card, you can quickly see incident status and assignees.
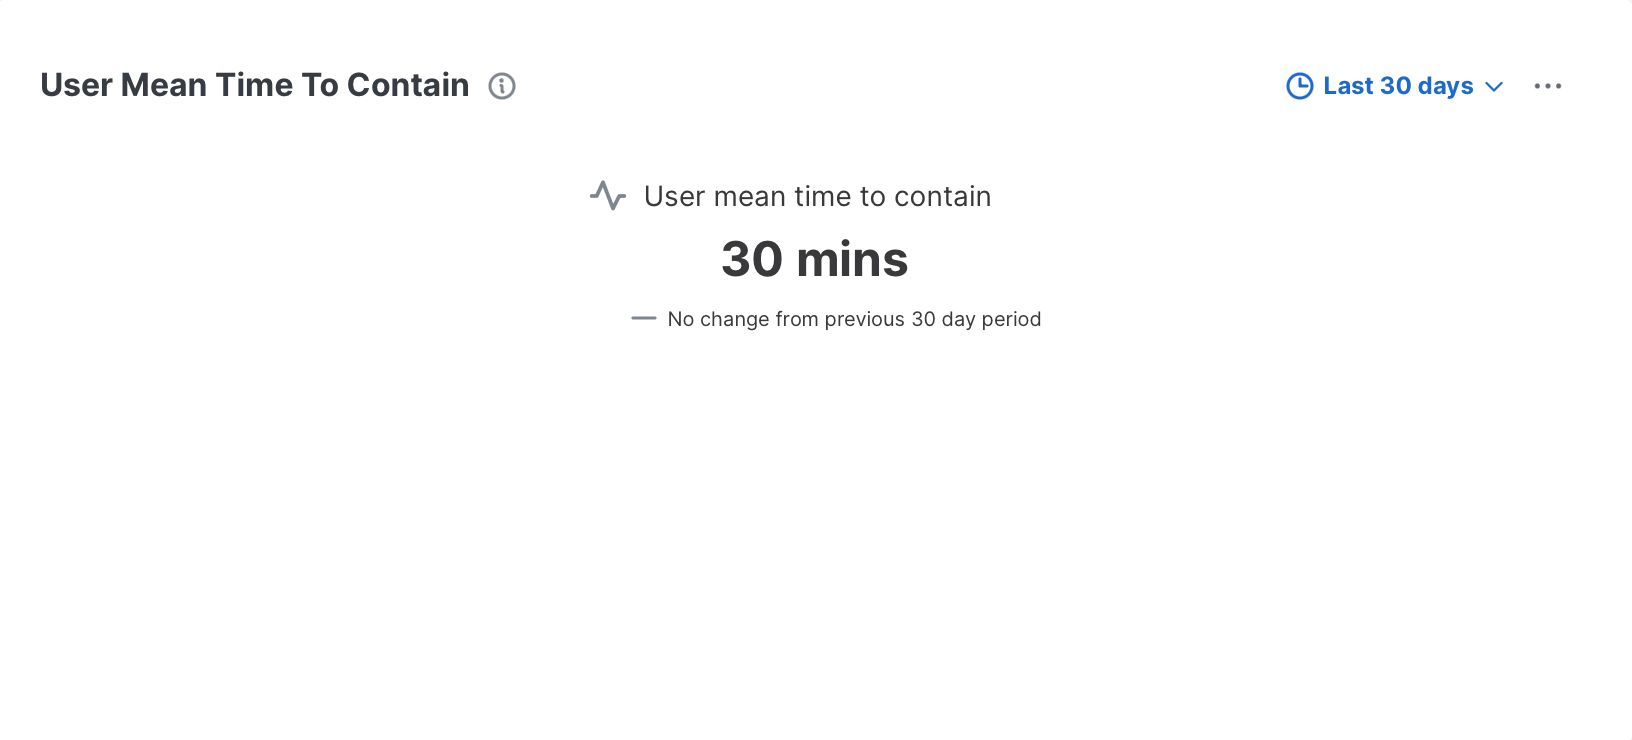
The User Mean Time To Contain card displays the average time the status of the incidents initially changed from any of the New statuses to the Open: Contained status by you during the selected timeframe. The New status only includes incidents that were created by a system during the selected timeframe. This allows you to quickly see the average time it took for you to effectively contain a new incident. It also displays the increased or decreased time from the previous day, week, or month, depending on the selected timeframe. For details on incident statuses, see Available Statuses.
The following Automation cards are available to all users in the Customize Dashboards dialog box:
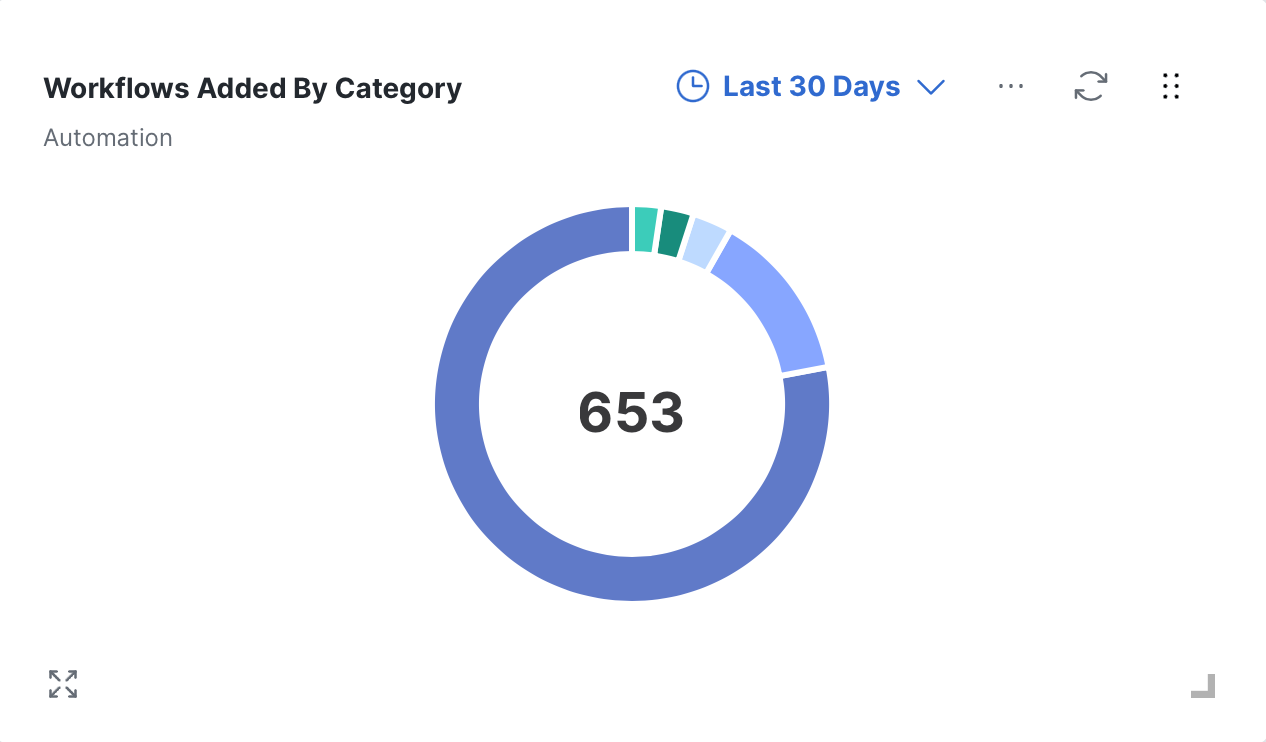
The Workflows added by category card shows the number of workflows created or imported during the selected date range and the number of workflows tagged to the top 5 categories for the selected date range. Hover the mouse over one of the colored segments of the circle graph to see the category name and number of workflows assigned to that category during the selected date range.
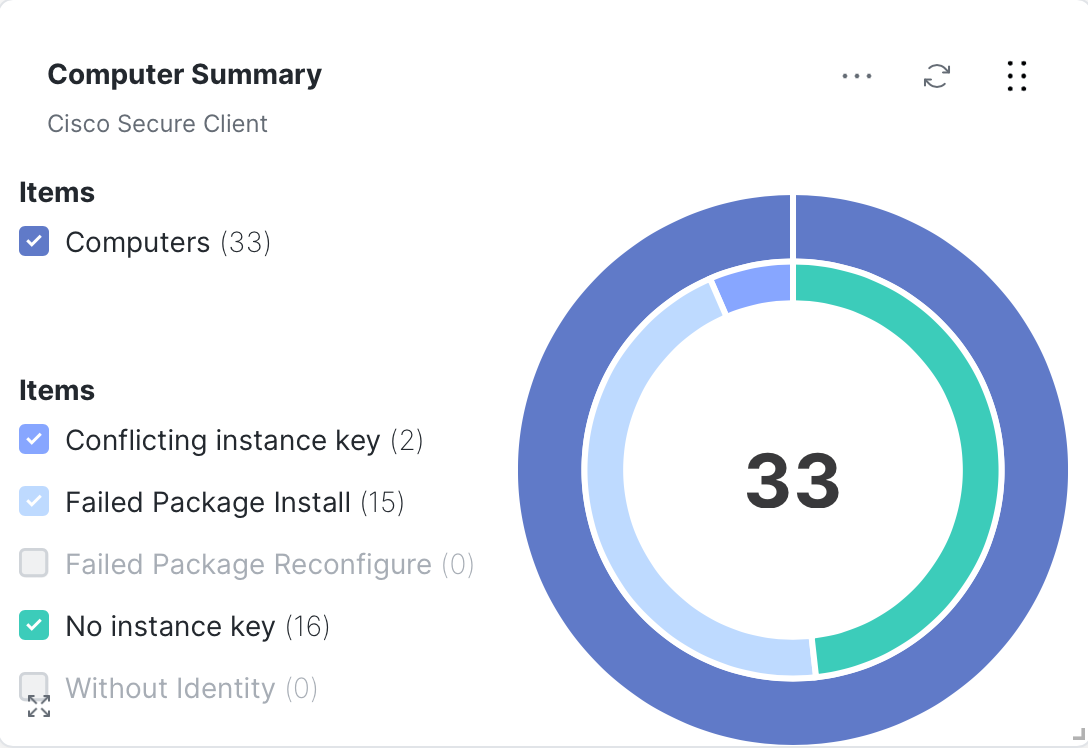
The following Secure Client cards are available to all users in the Customize Dashboards dialog box:
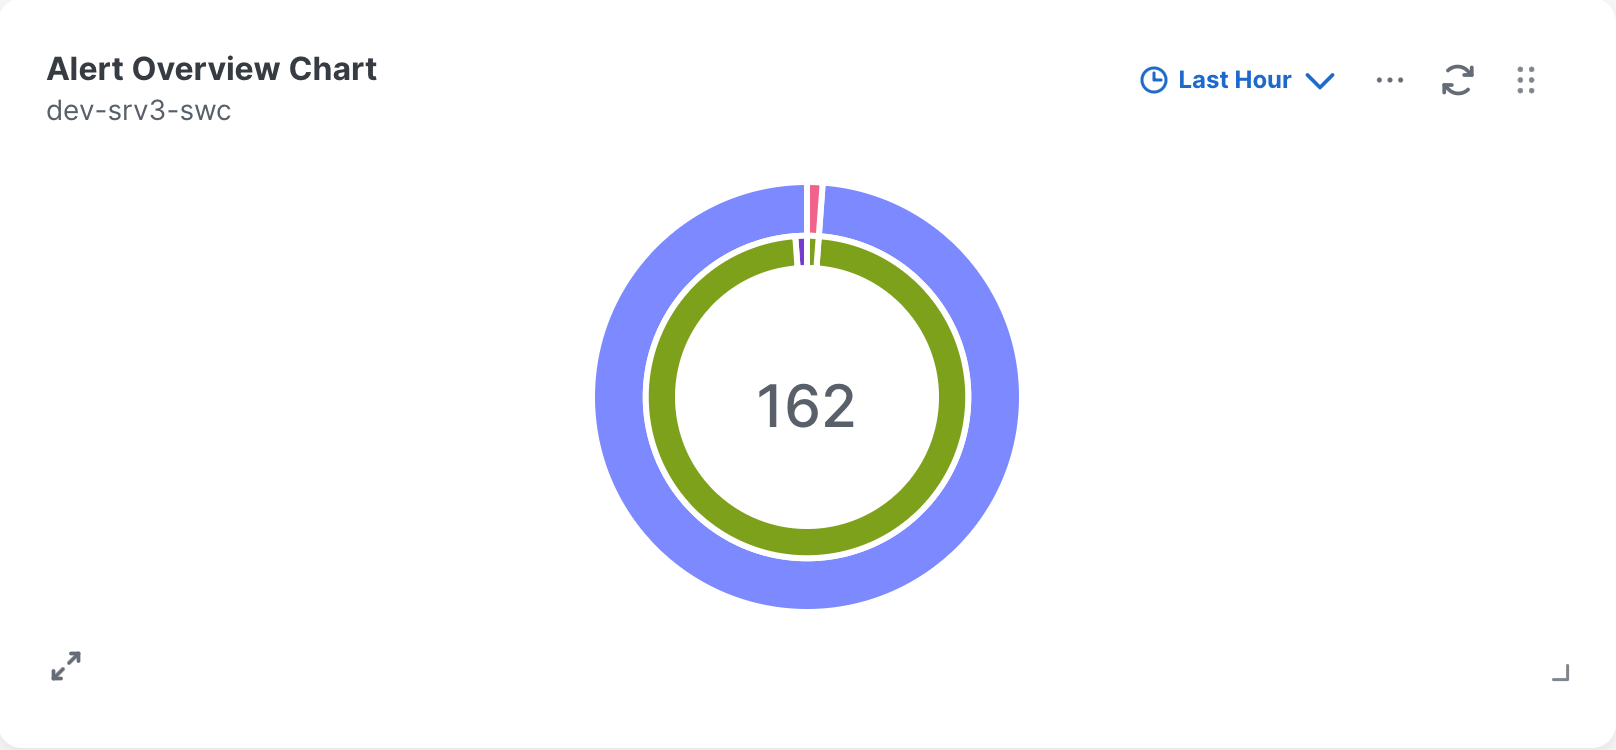
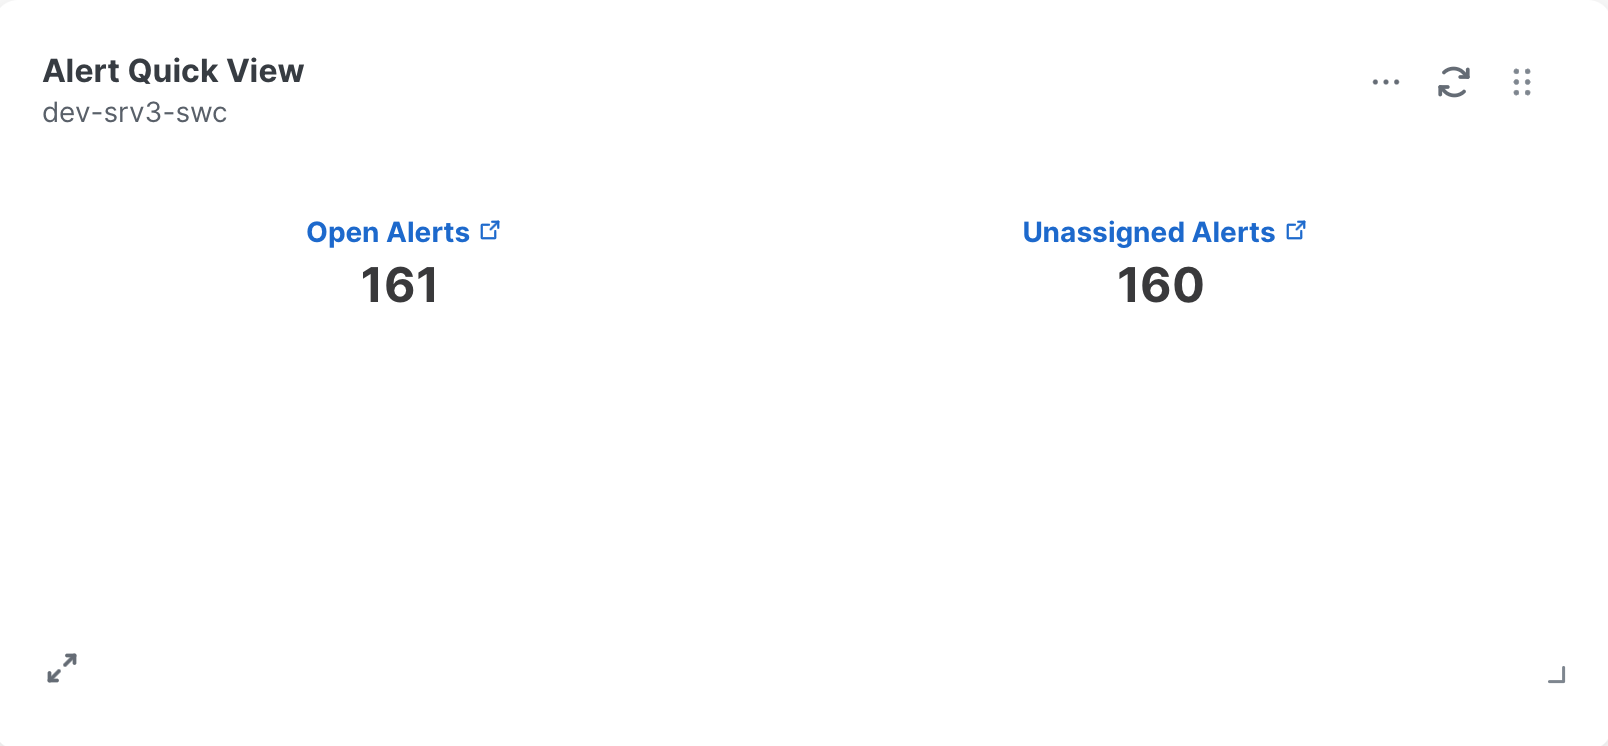
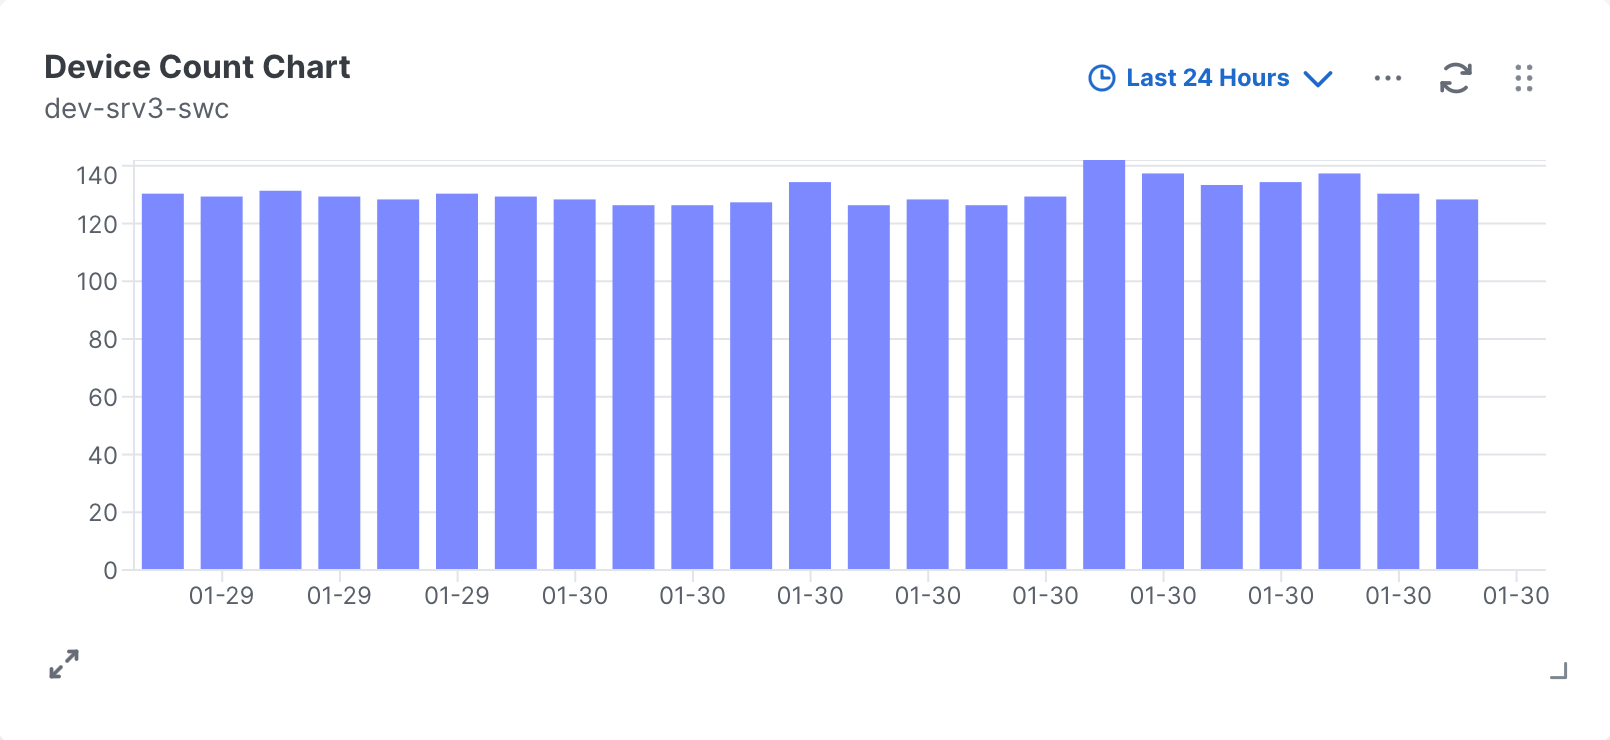
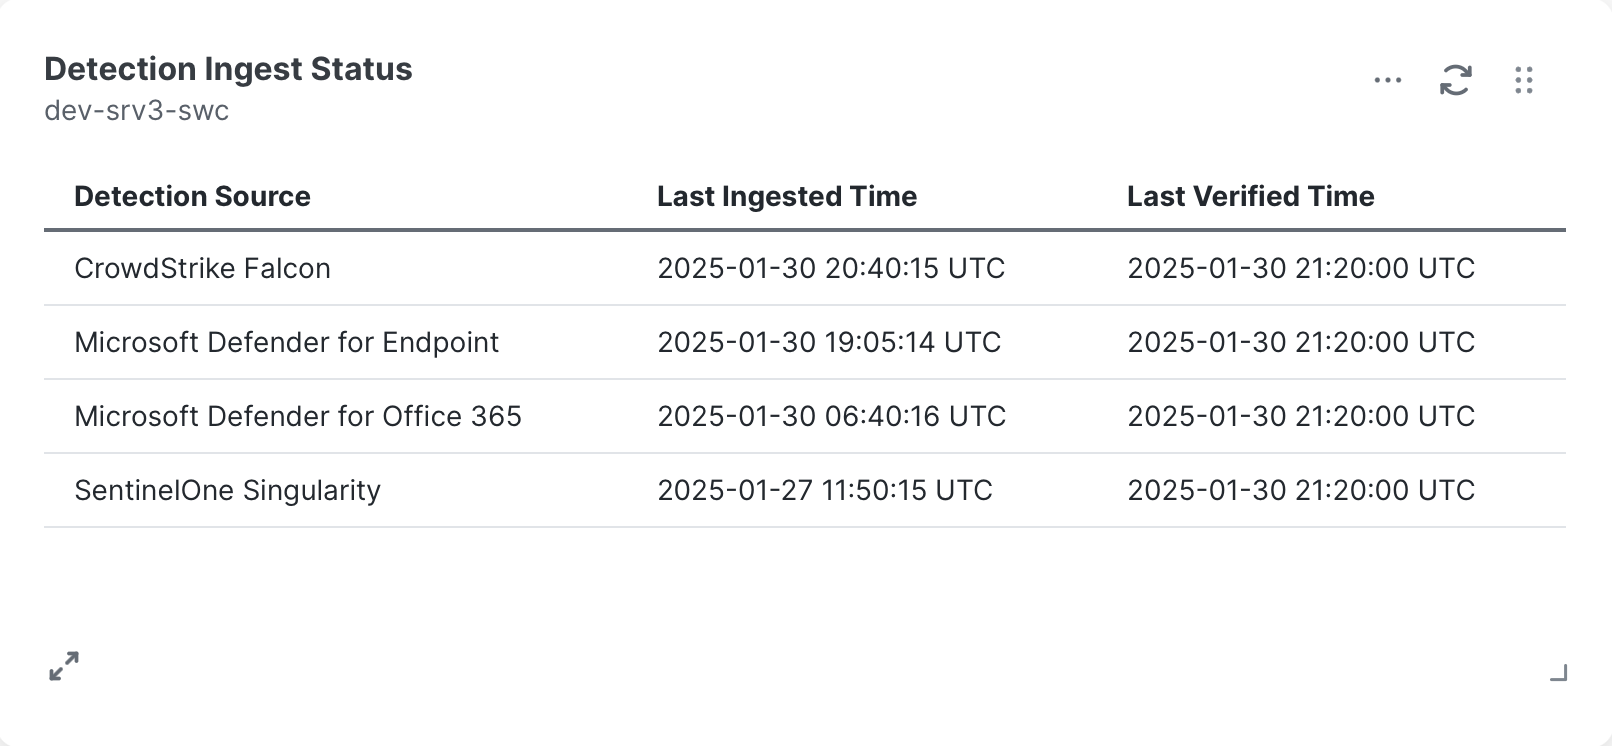
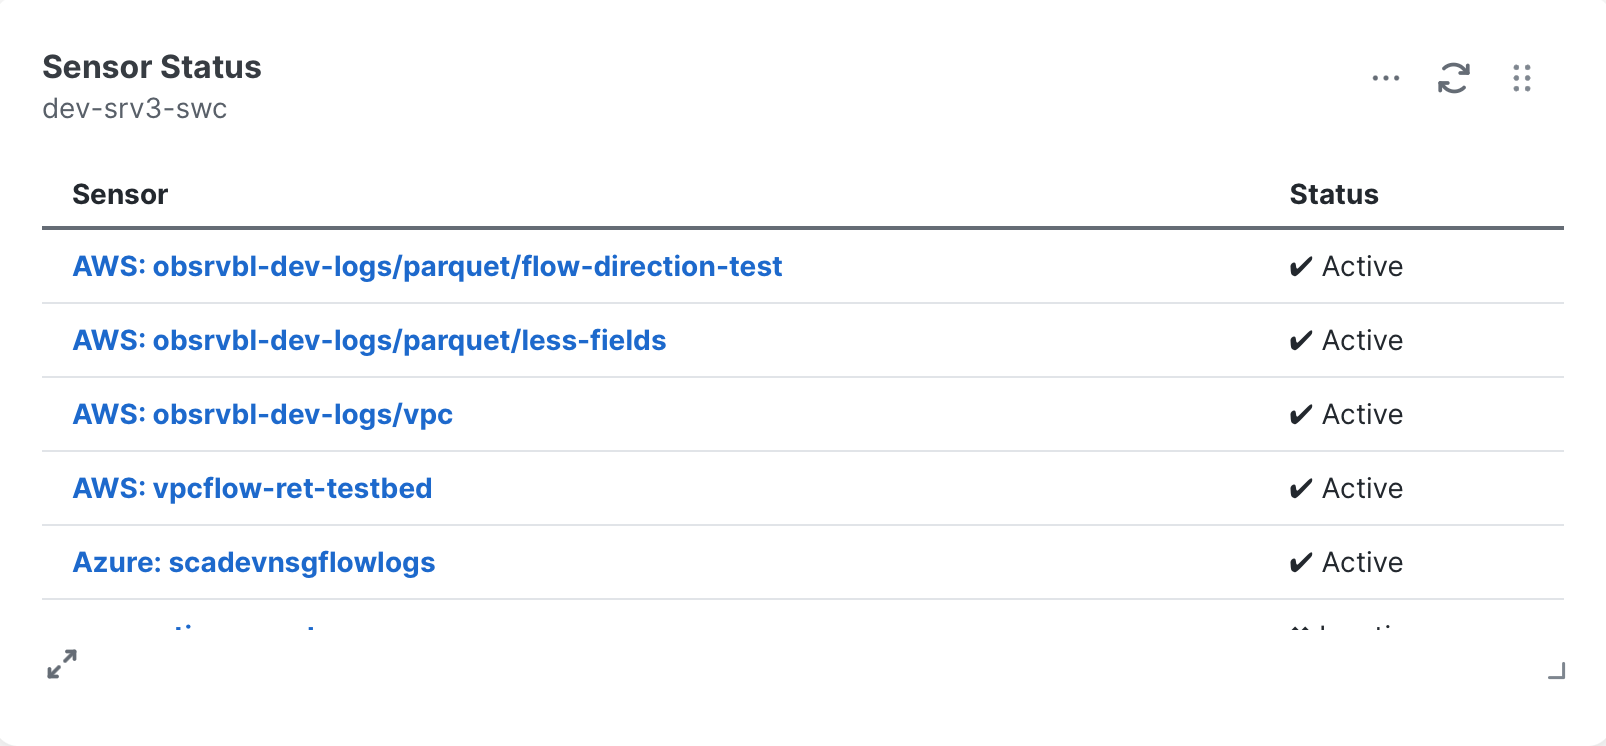
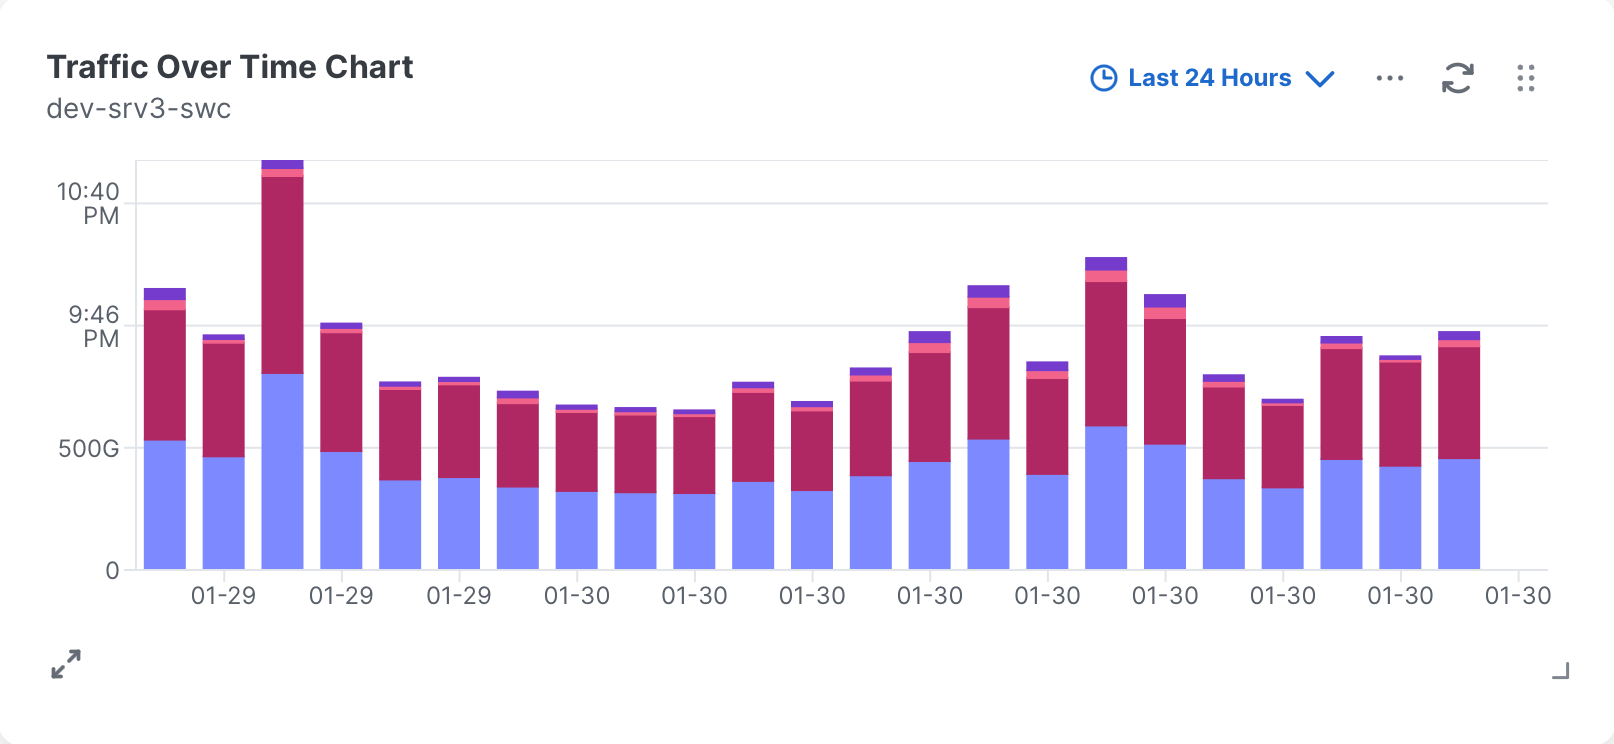
The following Secure Cloud Analytics cards are available to all users in the Customize Dashboards dialog box:
Displays a pie chart that shows, based on the selected time frame, in the outer ring:
-
new Secure Cloud Analytics alerts created within the time frame
-
open Secure Cloud Analytics alerts created before the time frame, and not yet closed within the time frame
-
closed Secure Cloud Analytics alerts closed during the time frame
And in the inner ring:
-
assigned Secure Cloud Analytics alerts
-
unassigned Secure Cloud Analytics alerts
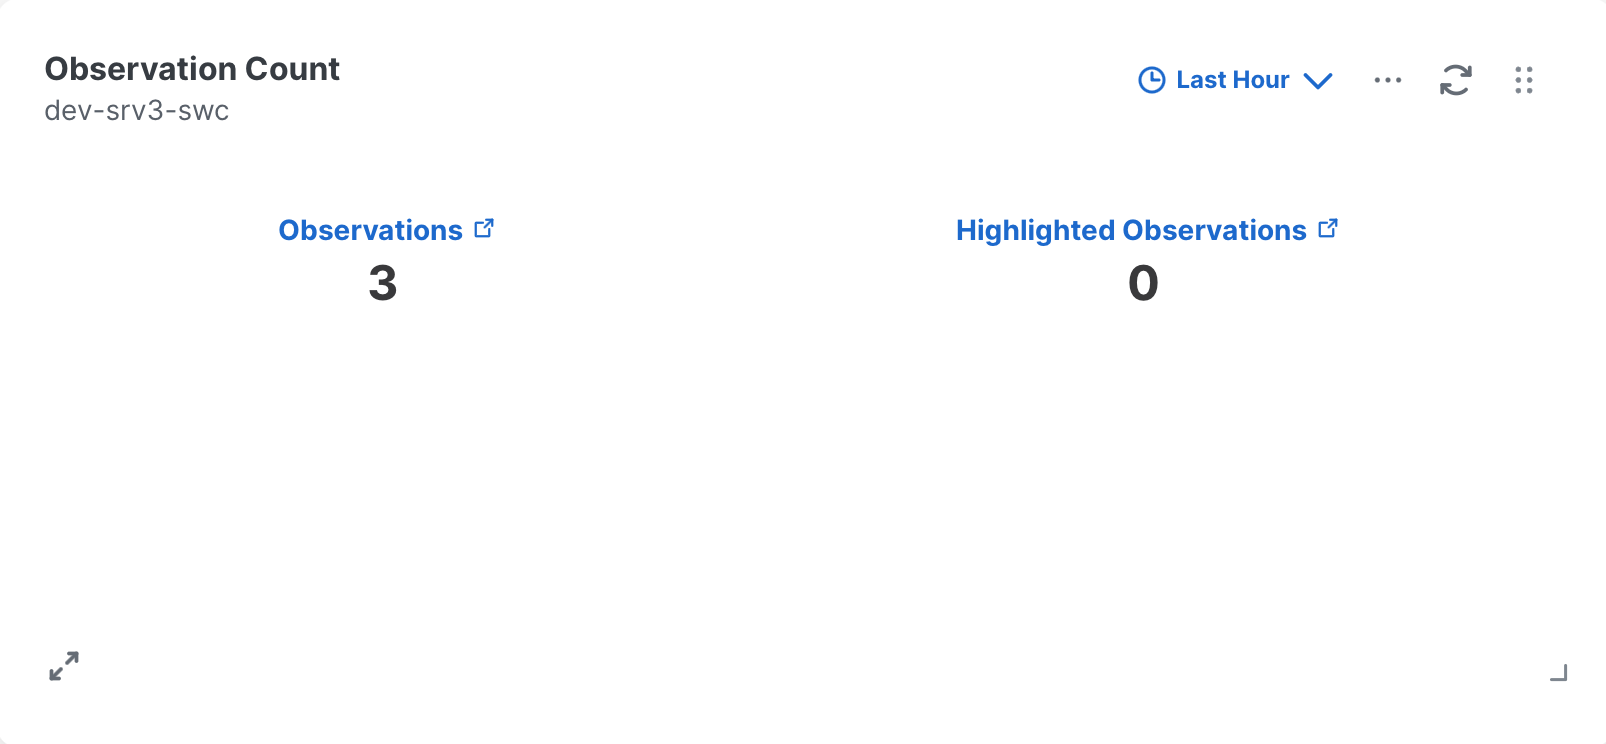
Displays the total number of observations that Secure Cloud Analytics generated in a given time frame, and the total number of highlighted observations in that time frame. The Observations and Highlighted Observations links take you to the Secure Cloud Analytics portal UI to view more information about these observations.


