Investigate Using Ribbon Extension
You can find observables on a web page and start an investigation directly from the Cisco XDR ribbon extension using the Find observables on page icon on the ribbon or the Cisco XDR option in the context menu.
-
Navigate to a web page and click the
 (Cisco XDR Ribbon) icon in the browser bar.
 -
In the ribbon extension, click the
 (Find Observables on Page) icon to begin extracting the observables from the text or PDF file on the web page.
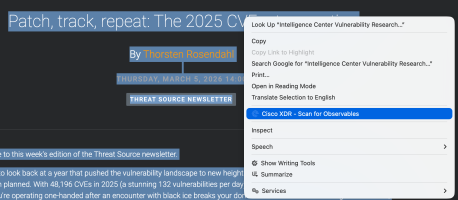
Optionally, you can select text on the page, right-click and choose Cisco XDR - Scan for Observables in the context menu.
Note: If you add an observable to an active or new case from the Pivot menu using the Cisco XDR option in the context menu, the ribbon extension icon displays a blue icon badge. The blue icon badge is only displayed if there are no unread notifications count displayed.

-
In the upper portion of the Observables on Page dialog, check the check boxes of the observables you want to investigate. Optionally, click Clean, Malicious, Suspicious, Unknown, or multiple disposition filters to filter the observables by disposition.
-
Perform any of the following tasks to proceed with your investigation:
-
Click Run Investigation to begin enriching the observables (see Investigate).
-
Click Add Observables to Case to add the selected observables to an existing case or create a new case (see Casebook App).
-
Respond to the threat from the Pivot menu next to an observable and perform tasks such as investigate, create a judgment for the observable, initiate automation workflows, or pivot to integrated products to perform additional actions.
-