Troubleshooting
This topic provides solutions to common issues when installing and configuring sensors.
 Resolve Time Drift and Synchronizing NTP
By default, a sensor is configured to use pool.ntp.org for NTP time synchronization, and to ensure data displays properly in the portal. If outbound NTP is not permitted, you may need to update the NTP settings. If the sensor time is not properly synchronized, you may not see flows properly on the Activities page or they may not be considered for detections.
-
SSH into the sensor as an administrator.
-
At the command prompt, enter
timedatect1 statusand press Enter to verify if NTP is synchronized. See the following image for an example of a sensor that is not properly synchronized with NTP: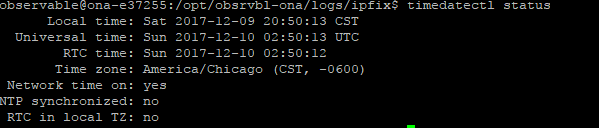
- Enter the following command and press Enter to ensure that the correct NTP packages are installed and up-to-date:
sudo apt-get update && sudo apt-get install -y ntpdate ntp
- Enter
sudo service ntp stopand press Enter to stop the NTP service. -
Enter
sudo ntpdate pool.ntp.organd press enter to set the NTP server to synchronize against.If outbound NTP is not allowed, the system displays an error message stating that it cannot find the server. See the following image for an example.

-
If outbound NTP is not allowed, specify an internal IP address instead of
pool.ntp.org. See the following image for an example.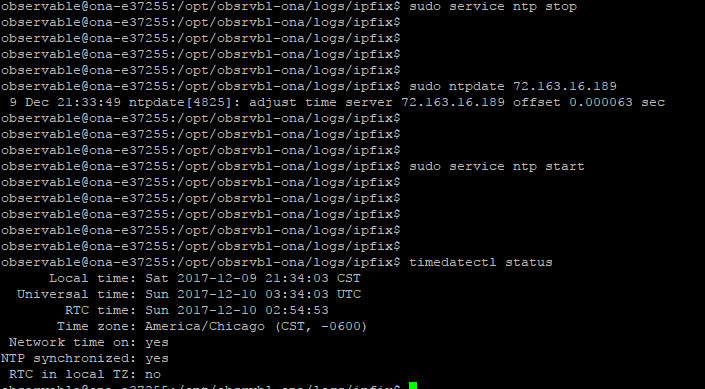
- Enter
sudo service ntp startand press Enter to start the NTP service.
Resolve Unidirectional Traffic Errors
Cisco XDR service detects when a sensor is not seeing bidirectional flows. For example, a large number of hosts with only outbound or inbound TCP traffic indicates some of the data feed is missing. This could be an issue with an improperly configured mirror port, missing VLAN, or an improperly configured firewall that is not sending flow data on all its interfaces. You can search for traffic passing through the mirror port and determine whether it is unidirectional or bidirectional.
-
SSH into the sensor as an administrator.
-
At the command prompt, enter
ifconfig –aand press Enter to view the list of interfaces. The mirror port interface typically has no associated IP address, and much larger packet and byte counts than the other interfaces. See the following image for an example; theenp0s8interface sees much more traffic, which is indicative of a mirror port.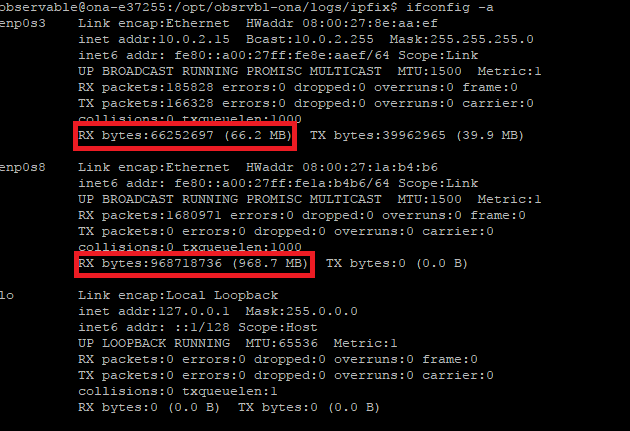
-
Enter the following command:
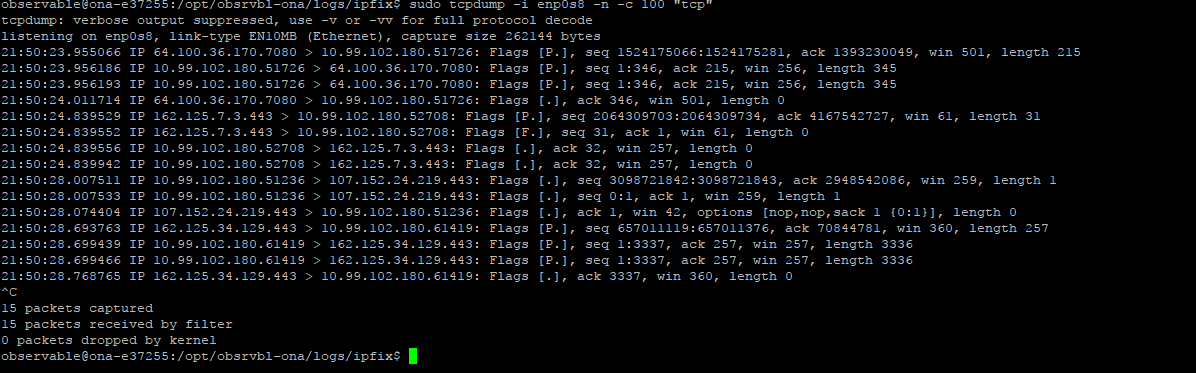
sudo tcpdump –i <mirror-interface-name> -n –c 100 "tcp"(replace
<mirror-interface-name>with an interface name, such aseth0).Press Enter to capture traffic passing through the mirror interface, to ensure it is seeing TCP traffic, not just broadcast traffic. See the following image for an example.
-
Enter the following command:
sudo tcpdump –i <mirror-interface-name> -n –c 100 "port 9996"(replace
<mirror-interface-name>with an interface name, such aseth0).Press Enter to capture traffic that matches port 9996/TCP. You can configure the command as necessary to look for specific traffic. See the following image for an example.

-
Enter the following command:
sudo tcpdump –i <mirror-interface-name> -n –c 100 "src 10.99.102.180"( replace
<mirror-interface-name>with an interface name, such aseth0).Press Enter to capture traffic that matches a source IP address of
10.99.102.180. See the following image for an example.
Capture Packets from the Sensor
Occasionally, Cisco Support may need to verify the flow data being received by the sensor. We recommend that you do this by generating a packet capture of the flows. You can also open the packet capture in Wireshark to review the data.
-
SSH into the sensor as an administrator.
-
At the prompt, enter
sudo tcpdump -Dand press Enter to view a list of interfaces.Note the name of your sensor's Control interface.
-
At the prompt, enter
sudo tcpdump -i <control_interface> -n -c 100 "port <port_number>" -w <pcap_name>, replace <control_interface> with your Control interface name, <port_number> with the port number corresponding to your configured flow data, and <pcap_name> with a name for the generated pcap file, then press Enter. The system generates a pcap file with the specified name for that interface's traffic, over the specified port. -
Log out of your sensor.
-
Using an SFTP program, such as PuTTY SFTP (PSFTP), or WinSCP, log into the sensor.
-
At the prompt, enter
get <pcap_name>, replace <pcap_name> with your generated pcap file name, and press Enter to transfer the file to your local workstation.
Analyze the Packet Capture in Wireshark
1. Download and install Wireshark, then open Wireshark.
2. Select File > Open, then select your pcap file.
3. Select Analyze > Decode As.
4. Click + to add a new rule.
5. Choose CFLOW from the Current drop-down, then click OK. The UI updates to display only packets that are related to NetFlow, IPFIX, or sFlow. If no results appear, the pcap does not contain NetFlow-related packets, and flow data collection is incorrectly configured on the sensor.