Indicators
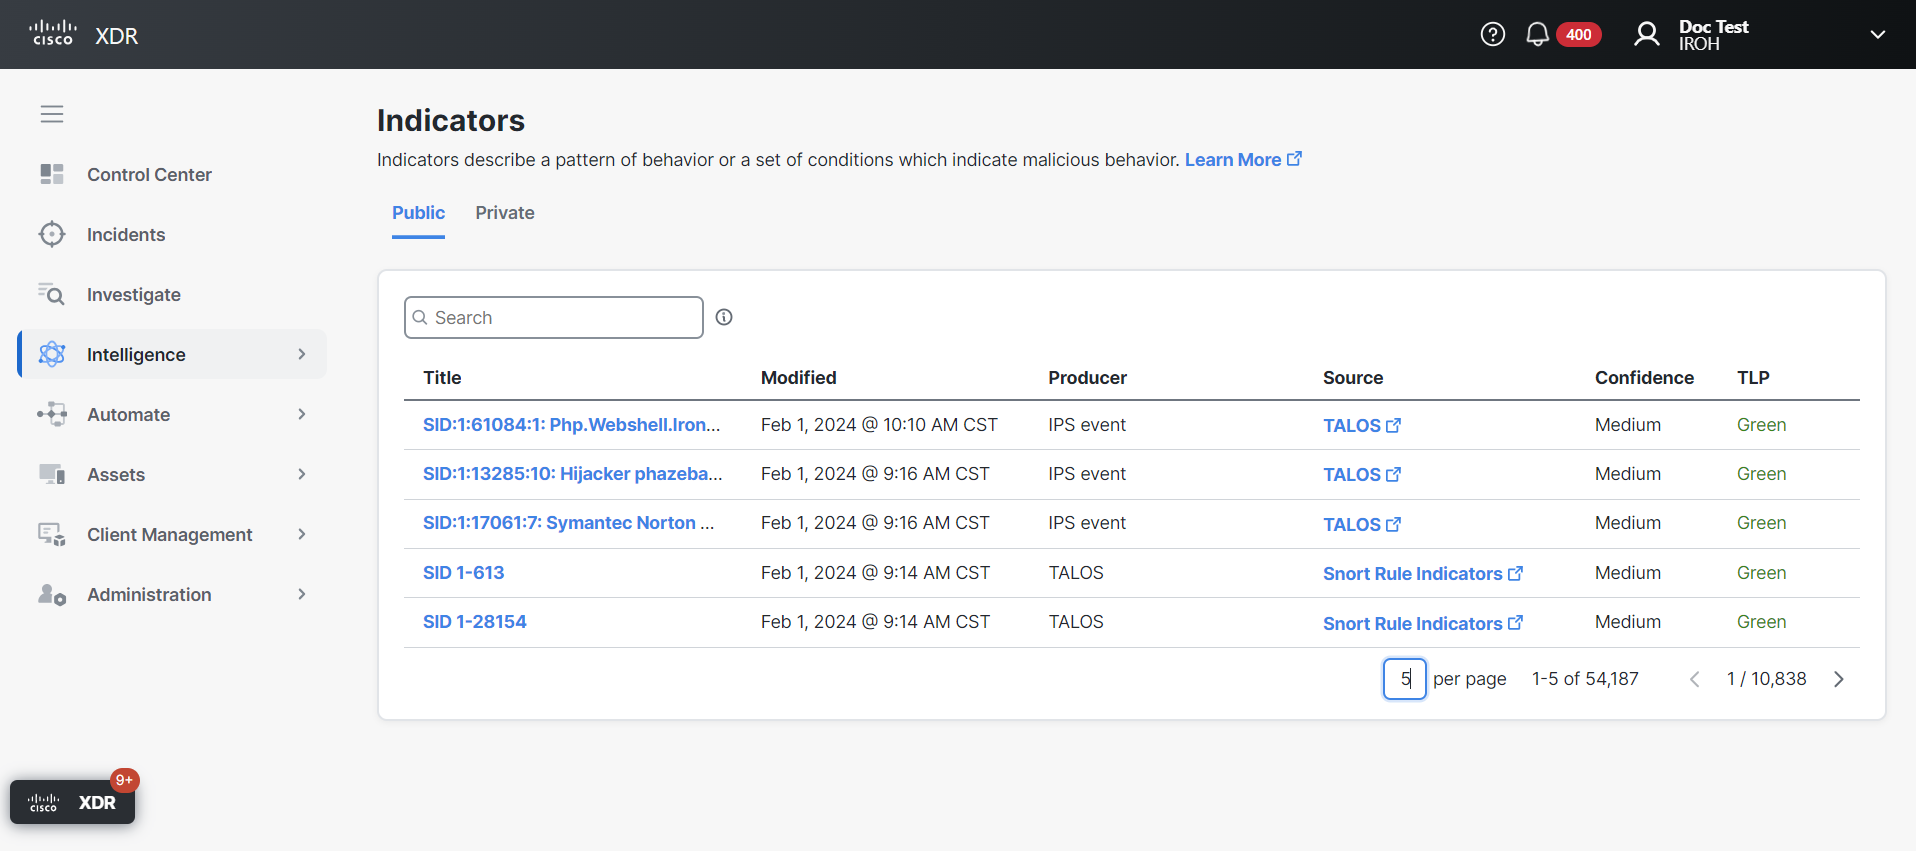
The Indicators tab provides the ability to search for stored public and private threat intelligence indicators that are deemed most relevant to incident response (for more information, see Intelligence).
An indicator describes a pattern of behavior or a set of conditions which indicate malicious behavior. Some indicators are more indicative than others of malicious behavior, so knowing exactly which bad behaviors an observable (such as a domain or an IP address) is exhibiting can help an incident responder decide what to do next.
The Public indicators are displayed by default. Click Private in the upper right corner to display the list of private indicators.
|
Column Name |
Description |
|---|---|
|
Title |
Describes the full pattern of behavior or a set of conditions which indicate malicious behavior. A Short Description may also be displayed, if available. Click the Click the indicator Name to open the Indicator Details drawer and view additional information. |
|
Modified |
Date and time the data was last updated. Click the |
|
Source |
The source that reported the indicator to the Cisco XDR module. |
|
TLP |
A color-coded Traffic Light Protocol (TLP) designation that indicates how information should be shared and who has access to it.
For details, see Traffic Light Protocol (TLP) Definitions and Usage. |
|
Confidence |
The confidence level of the system that produced the data of its accuracy. |
|
Producer |
Where the CTIM entity (data) originated, for example who encoded the intel into a data object. |
From the Indicators tab, you can perform the following tasks:
Use the Search text box in the upper portion of the page to narrow the display of indicators. Click the tooltip next to the text box to view the search criteria and examples of common searches. Only stored data is searchable; data sources outside of Cisco XDR are not searchable.
You can sort the Indicators table alphabetically or by date and time. Click the (Sort) icon next to the Title or Modified columns to sort the list:
- Title - Sort in alphabetical ascending or descending order.
- Modified - Sort by oldest or most recent date and time.
You can create a private indicator if you see a pattern of behavior or a set of conditions which indicate malicious behavior.
-
Choose Intelligence in the navigation menu and click the Indicators tab.
-
Click Private in the upper right corner to display the list of private indicators.
-
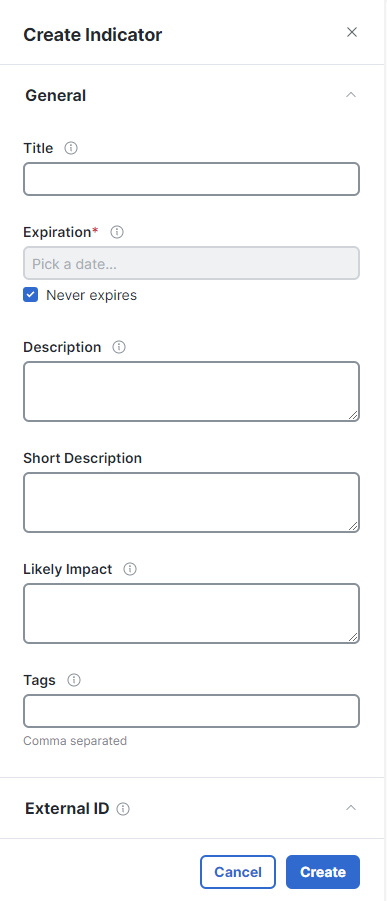
Click Create Indicator in the upper right corner to open the Create indicator drawer.
- Complete the form:
-
Source - Enter the title of the source of the indicator.
-
Source URI - Enter the URL of the source of the indicator.
-
Confidence - Click the option that indicates the level of confidence of the accuracy of the indicator.
-
Severity - Click the option that indicates the severity level of the indicator.
-
TLP - Click the option for the TLP designation.
- Click Save. A message is displayed in the lower right corner indicating the new indicator has been created.

|
Field |
Description |
|---|---|
|
Title |
Enter a short descriptive title to be used as the primary display and reference value. |
|
Expiration |
Required. By default, indicators are set to never expire. If you want to specify an expiration date, uncheck the Never expires check box and pick a date on the calendar. |
|
Description |
Enter a descriptive summary of the indicator that provides more details. |
|
Short Description |
Enter a single line, short summary of the indicator. |
|
Likely Impact |
Enter the expected impact within the relevant context if the indicator occurs. |
|
Tags |
Enter searchable descriptors for the indicator, separated by commas. |
|
External ID |
Click Add External ID and enter the external reference ID in the text box. You can enter multiple external IDs. To remove an external ID, click the Delete icon next to it. |
|
Origin |
Enter the origin information for the indicator: |
|
Flags |
Specify the confidence, severity, and TLP designation for the indicator: |
|
Kill chain phases |
Check the check boxes for all relevant kill chain phases indicated by the indicator. |
|
Indicator Type |
Check the check boxes for all applicable type classifications to be assigned to the indicator. |
|
External references |
Click Add external reference and enter information about external sources of the indicator in the text box. You can add multiple external references. To remove an external reference, click Remove. |
Click the indicator title to open the Indicator drawer and view additional information, download the indicator in JSON format, edit or delete a private indicator, and view the Indicator Detail page.
Expand the General panel in the Indicator drawer and view the following information:
|
Modified |
Date and time the data was last updated. |
|
Producer |
Where the CTIM entity (data) originated, for example who encoded the intel into a data object. |
|
Source |
The Cisco XDR module where the indicator was produced. |
|
TLP |
Traffic Light Protocol designation that indicates how information should be shared (red, amber, green, or white). |
Expand the Tags panel in the Indicator drawer to view the descriptor tags for the indicator.
Expand the JSON panel in the Indicator drawer to view the indicator in JSON format. Click Copy or Download to copy or download the data displayed in JSON format.
If you have private indicators displayed, you have the ability to edit an indicator by clicking Edit in the Indicator drawer. Modify the indicator settings and then click Save to save your changes.
You can delete a private indicator if it is no longer relevant.
-
Choose Intelligence in the navigation menu and click the Indicators tab.
-
Click Private in the upper right corner to display the list of private indicators.
-
Click the indicator title to open the Indicator drawer.
- Click Delete.
- On the Delete indicator confirmation dialog box, click Delete. A message is displayed in the lower right corner indicating the indicator was successfully deleted.
Note: You can also delete a private indicator from the Indicator Detail page. Click View indicator detail in the lower portion of the Indicator drawer and then click Delete indicator in the upper right corner on the Indicator Detail page.
To view all the information associated with the indicator, click the indicator Title to open the Indicator drawer and then click View indicator detail.
From this page, you can view an overview of the indicator, which includes threat intelligence context for the indicator, and view the judgments, feeds, and external references associated with the indicator.
For more information, see Indicator Detail.
