Events
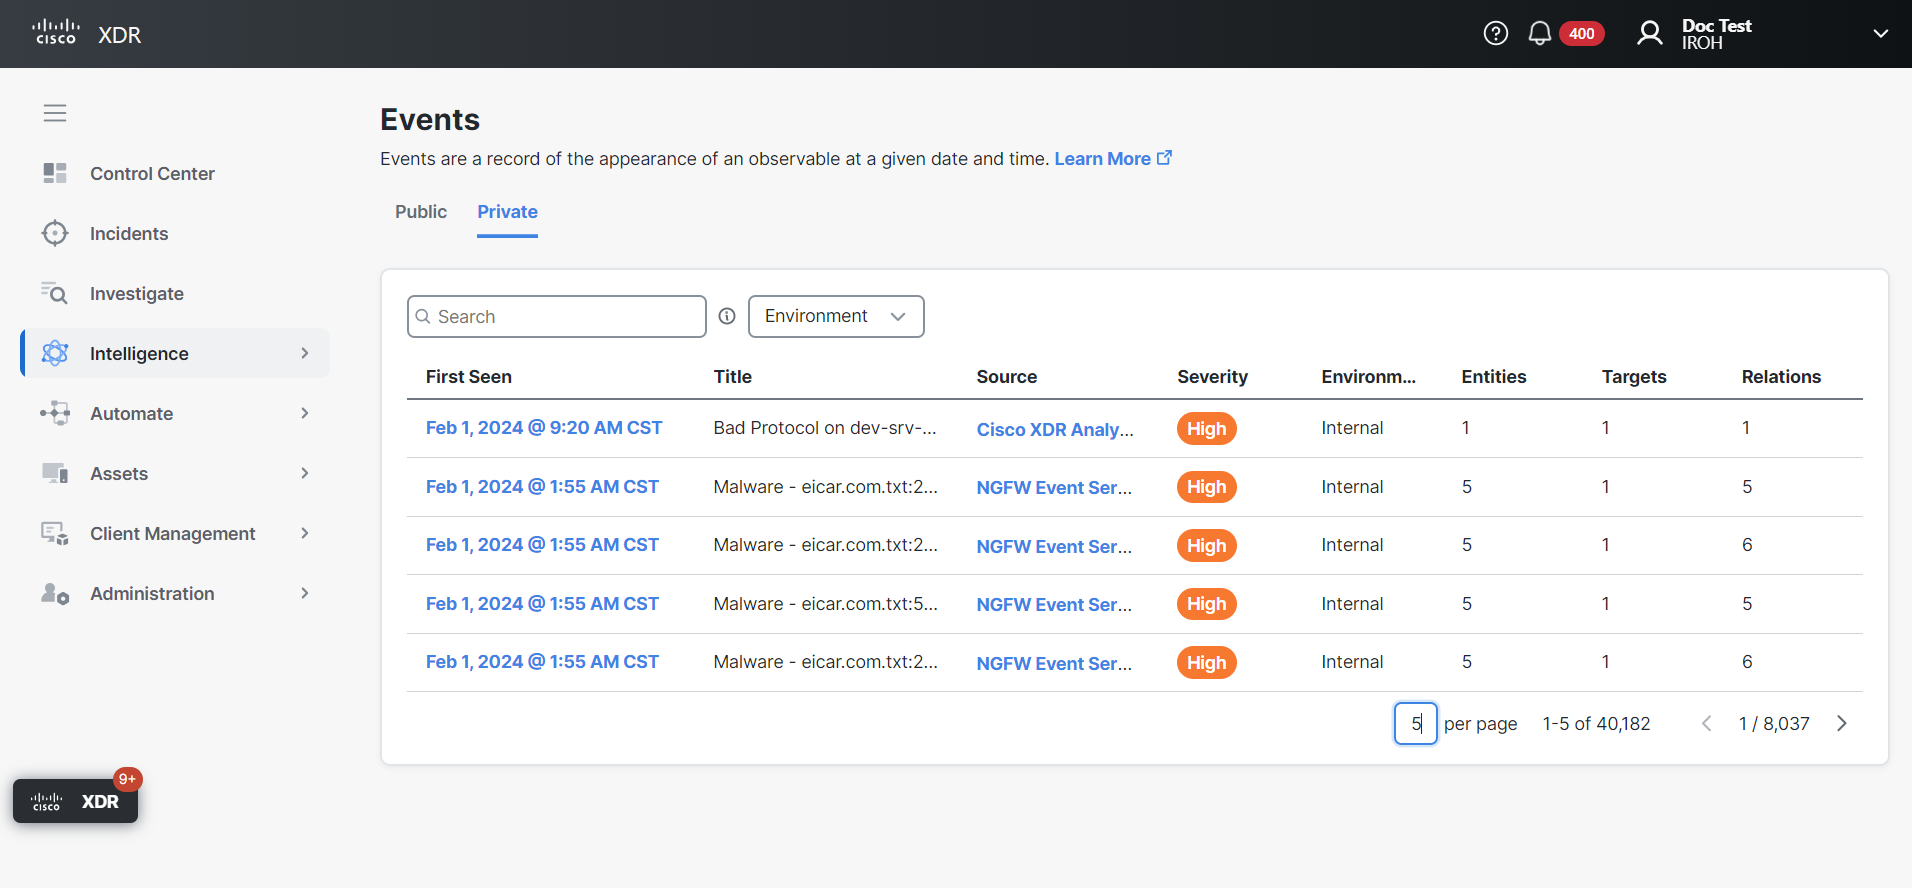
The Events tab provides the ability to search for public and private events that are deemed most relevant to incident response (for more information, see Intelligence). An event is a record of the appearance of a cyber observable at a given date and time. Events can optionally be related to indicators, providing threat intelligence context about the observable.
The Public events are displayed by default and for all environments.
-
Click Private in the upper right corner to display the list of private events.
-
Click the Environment filter and choose All, Internal, or Global from the drop-down list to display the events for a specific environment.
|
Column Name |
Description |
|---|---|
|
First Seen |
Date and time the event was first sighted. Click the |
|
Title |
The name assigned to the event. |
|
Source |
Where the CTIM entity (data) originated, for example who encoded the intel into a data object, and the process or device that observed the activity that is described in the event. |
|
Severity |
The seriousness of the threat of the observable (High or Medium). |
|
Environment |
Where the event was seen; either globally or in your internal environment. |
|
Observables |
The number of observables that were seen in the event, such as domain names, IP addresses, file hashes, PKI certificate serial numbers, and specific devices or users. |
|
Assets |
The number of devices, identities, or resources that the threat targeted. |
|
Relations |
The number of observables related to the event. |
From this page, you can perform the following tasks:
Use the Search text box in the upper portion of the page to narrow the display of events. Click the tooltip next to the text box to view the search criteria and examples of common searches. Only stored data is searchable; data sources outside of Cisco XDR are not searchable here.
You can sort the Events table by date and time. Click the (Sort) icon next to the First Seen columns to sort the list by oldest or most recent date and time.
Click the event in the First Seen column to open the Event drawer and view additional information, download the event in JSON format, and delete a private event. The upper panel displays the severity level and event title.
Expand the General panel and view information such as date and time the event was first seen, confidence level, source, sensor, environment, and resolution.
Expand the Description panel to view information about the event, such as the title, time it where it was observed, source, destination, file direction, disposition, file action, and a link to the event details. The information displayed in the Description panel may differ depending on the integration that reported it.
Expand the Observables panel to view a list of observables that were sighted in the event.
Click the ![]() (Pivot Menu) icon next to the observable to open the Pivot menu and view the disposition, observable type, and verdicts associated with the observable, and perform additional tasks.
(Pivot Menu) icon next to the observable to open the Pivot menu and view the disposition, observable type, and verdicts associated with the observable, and perform additional tasks.
Expand the Assets panel to view the assets that were identified in the event.
Click the ![]() (Pivot Menu) icon next to the observable to open the Pivot menu and view the disposition, observable type, and verdicts associated with the observable, and perform additional tasks.
(Pivot Menu) icon next to the observable to open the Pivot menu and view the disposition, observable type, and verdicts associated with the observable, and perform additional tasks.
Expand the Relations panel to view other observables that are connected (directional relationship) to the entities in the event.
Expand the JSON panel to view the event in JSON format. Click Copy or Download to copy or download the data displayed in JSON format.
