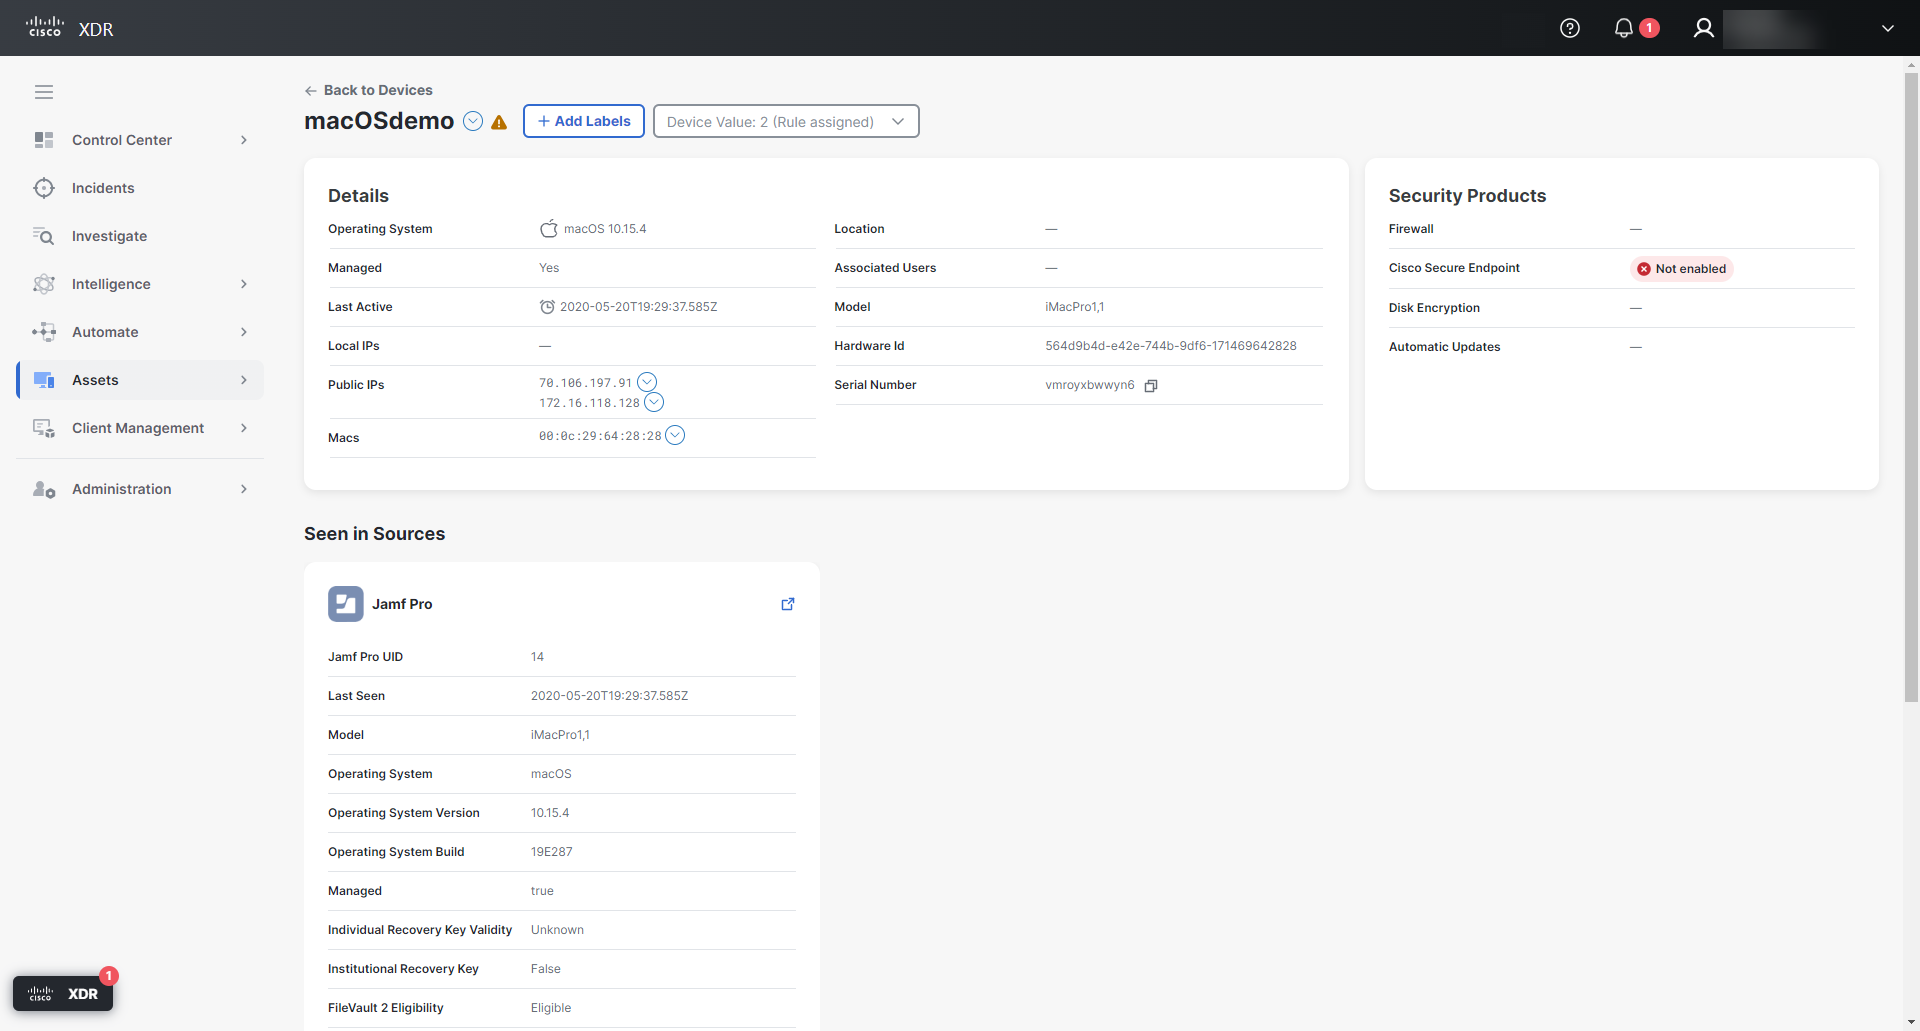
Device Details
The Device Details page provides more information about the device. The page consists of the header and tabs to access the Overview and Vulnerabilities pages.
In the header of the Device Details page, click the ![]() (Pivot Menu) icon next to the device name to take action on the device. Users with an Administrator role can manually update the Device Value and Add Labels to the device as well.
(Pivot Menu) icon next to the device name to take action on the device. Users with an Administrator role can manually update the Device Value and Add Labels to the device as well.
The Overview page provides additional details on the device, including device status, context, and which source provided which data.
For more information, see the Device Overview help topic.
The Vulnerabilities page provides a list of all of the vulnerabilities for the device identified by Cisco Vulnerability Management.
For more information, see the Vulnerabilities help topic.
Cisco XDR has a distributed set of capabilities presented in the form of apps and tools in the Cisco XDR ribbon. The ribbon is located in the lower portion of the page, and persists as you move between the dashboard and other security products in your environment. To aid in your research and investigation, use the ribbon to access the casebook, apps, settings, search observables for enrichment, and view incidents.
To add possibly compromised devices to the casebook in the Cisco XDR ribbon, you can use the Find Observables option in the ribbon, and based on the findings, add to a casebook or choose to investigate further in Threat Response. You can pivot from the ribbon to Threat Response, manually initiate an investigation, and search on the device by hostname, for example.
For more information, see the Ribbon help topic.
