Detection Settings
Note: Only users with an Administrator role can configure detections.
The Detection settings page allows you to view and configure the detections available for Cisco XDR native endpoint telemetry with more telemetry sources available in future releases. These detections are used to generate security events, which allow you to validate the data that is ingested by Cisco XDR for incident correlation.
Choose Administration > Detection Settings in the navigation menu to view and configure the detections from Cisco XDR native sources.
Note: Existing settings configured for NVM alerts on the Alert Priorities page in Secure Cloud Analytics are migrating to the Detection settings page. As the detections are migrated from Secure Cloud Analytics, the Detection Settings page may appear empty.
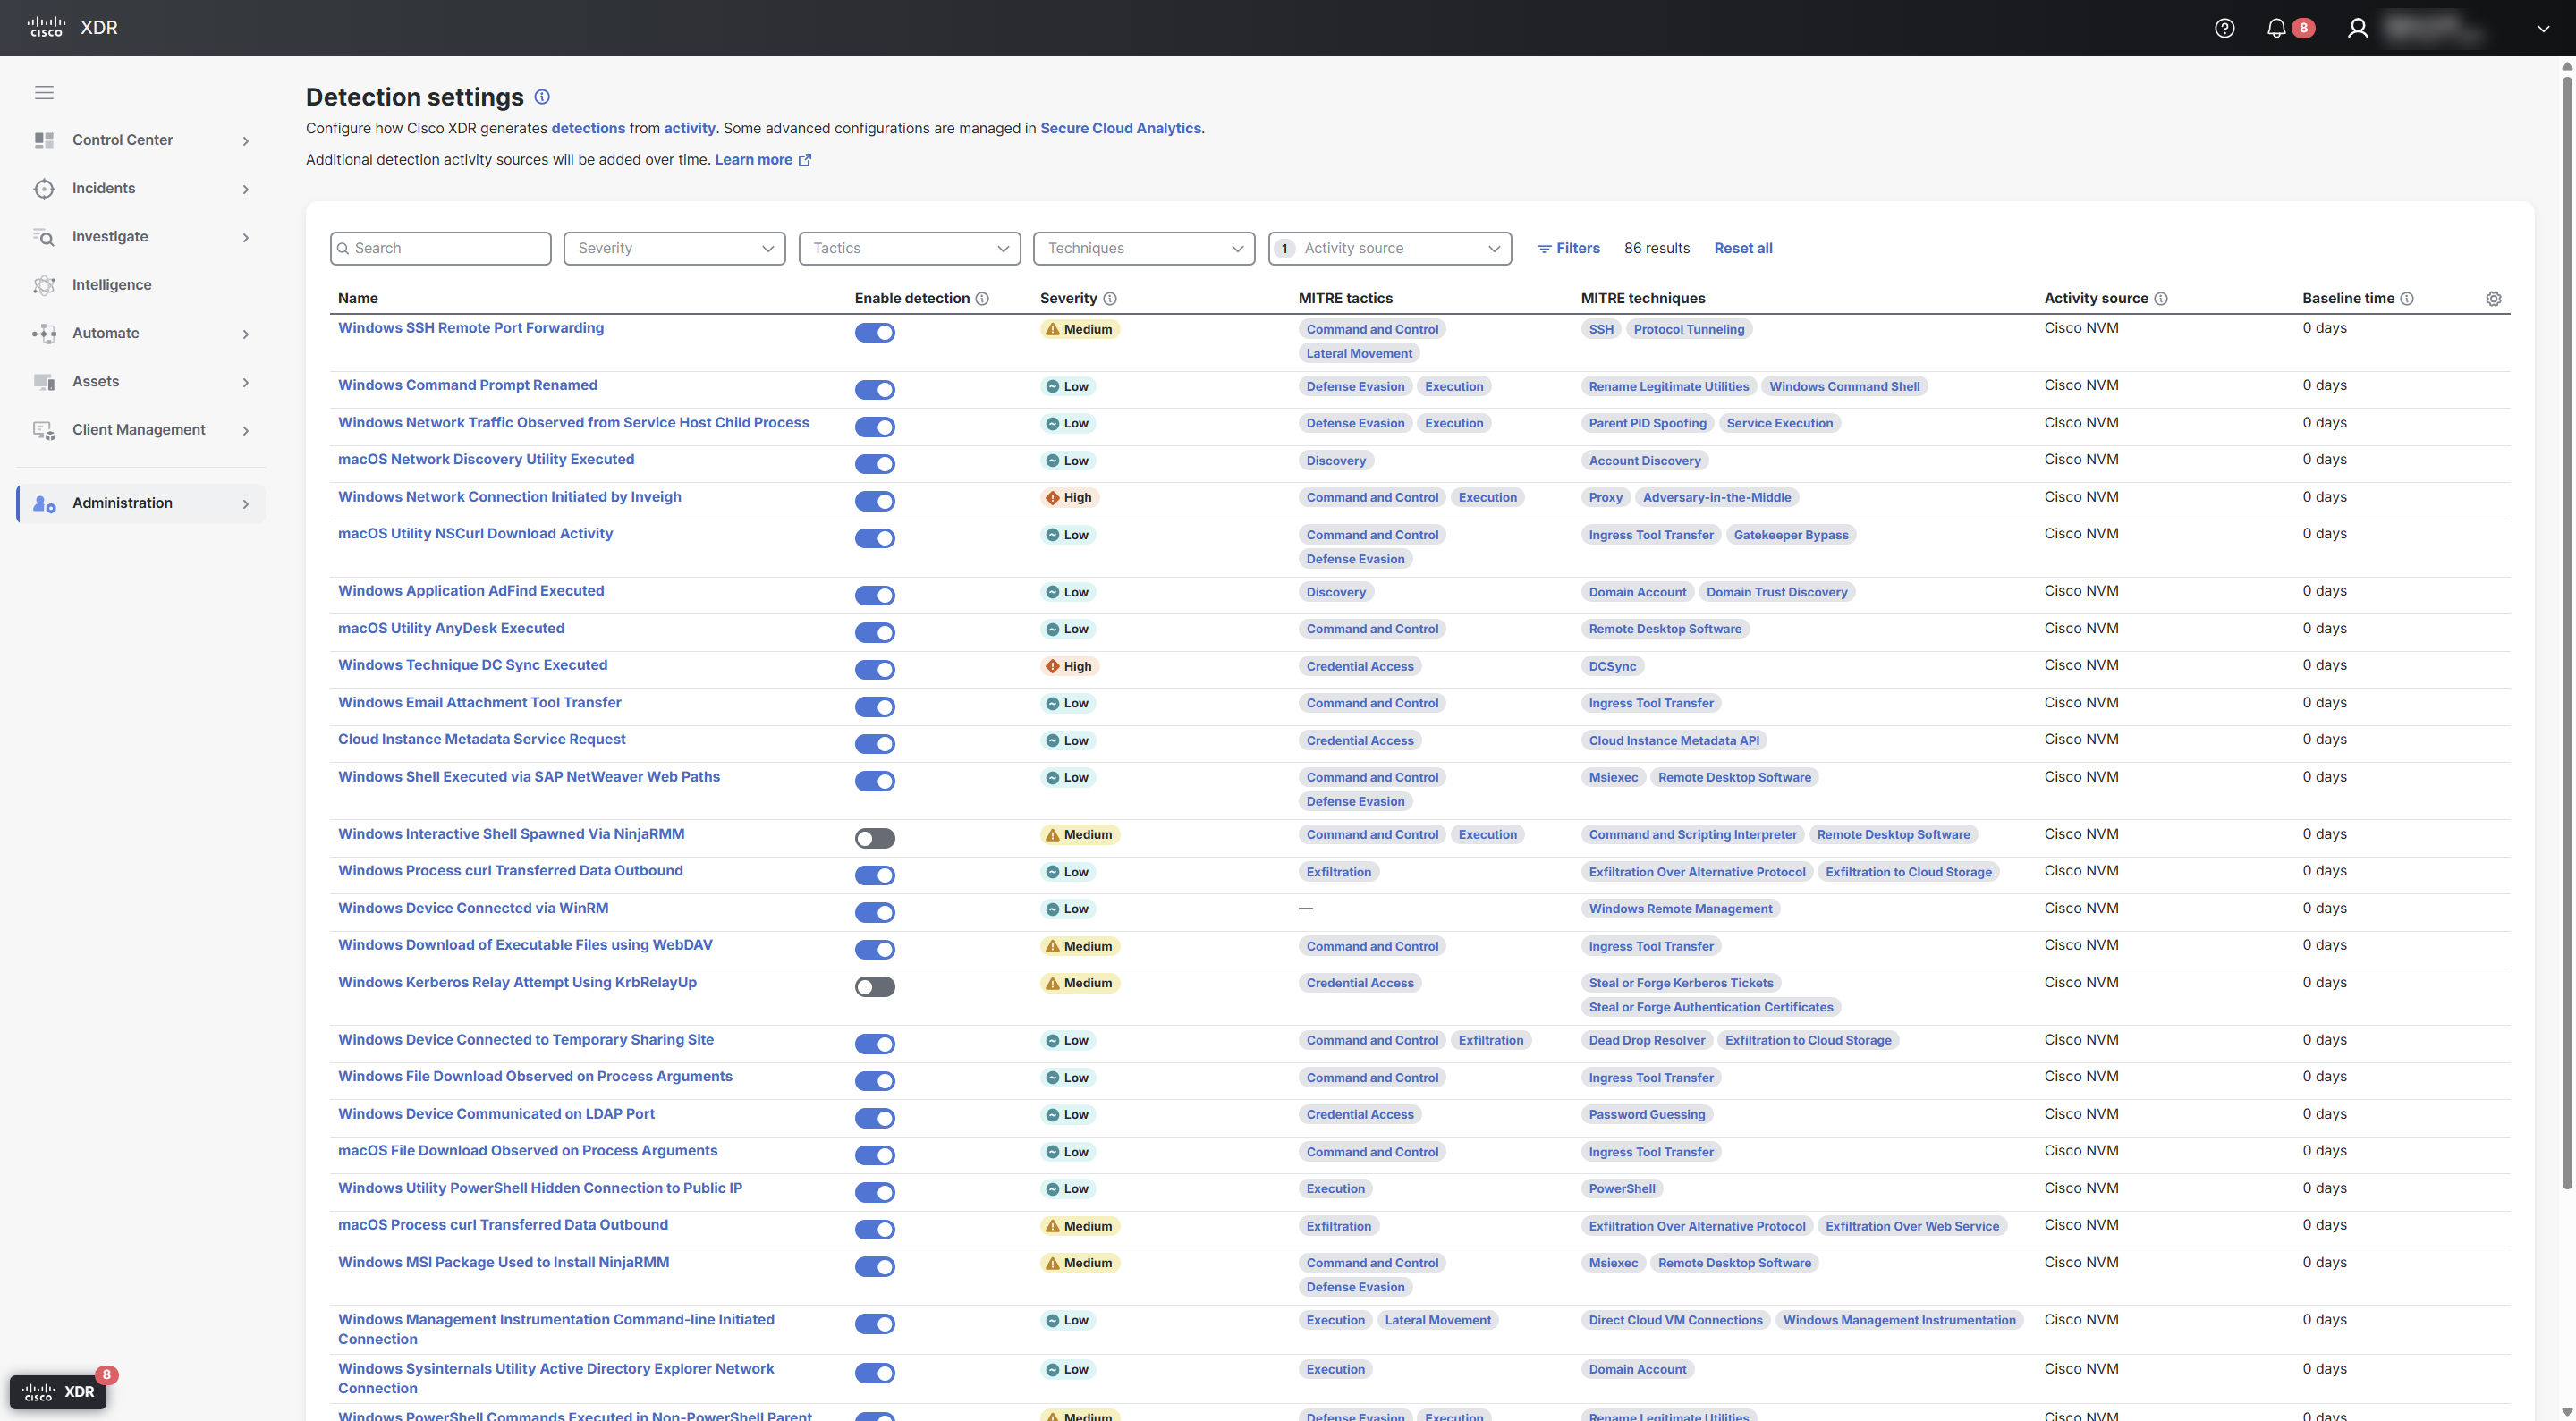
Note: The detections listed on this page are inactive until the required activity source is configured. Before enabling a detection, make sure the corresponding activity source, such as Cisco NVM, is configured in Cisco XDR.
 Detection Settings Table Column Descriptions
|
Column Name |
Description |
|---|---|
|
Name |
Name of the detection. |
|
Enable detection |
Toggle to enable or disable the detection from being created based on matching activity. When enabled, these detections may be included in incident correlation. |
|
Severity |
The severity of the detection defined by Cisco threat research (High, Medium, Low). |
|
MITRE tactics |
The associated MITRE ATT&CK® tactics for the detection. Click the tactic to view the description provided by MITRE ATT&CK®. For a list of all the tactic descriptions, see Enterprise Tactics. |
|
MITRE techniques |
The associated MITRE ATT&CK® techniques for the detection. Click the technique to view the description provided by MITRE ATT&CK®. For a list of all the technique descriptions, see Enterprise Techniques. |
|
Activity source |
The activity sources required for the detection. |
|
Detection source |
The system or product that generated the detection. This is an optional column that is only available in the Table settings drawer. For details, see Customize Columns. |
|
Baseline time |
The number of days of data collection required before the detection can trigger. |
Search, Filter, and Sort Detections
You can search, filter, and sort the detection to narrow the display to only those detections you want to view.
Search Detections
Use the Search field in the upper portion of the page to narrow down the display of detections. The search is triggered as you enter the criteria. You can search for detections by partial or complete name, and text within the detection's description. Search entries are not case sensitive.
Filter by Severity
The Severity menu allows you display detections based on the severity level (High, Medium, Low).
Click the Severity drop-down list and choose the severity level of the detections you want displayed in the table.
Filter by Tactics
The Tactics menu allows you to display detections based on the associated MITRE ATT&CK® tactics.
Click the Tactics drop-down list and choose the associated tactics of the detections you want displayed in the table.
Filter by Techniques
The Techniques menu allows you to display detections based on the associated MITRE ATT&CK® techniques.
Click the Techniques drop-down list and choose the associated techniques of the detections you want displayed in the table.
Filter by Activity Source
The Activity source menu allows you to filter the detections by the required activity sources. All activity sources are automatically shown by default.
Click the Activity source drop-down list and check the check boxes next to the sources to filter the detections displayed in the table.
Sort Detections
Click the  (Sort) icon next to the Name column header to sort the table in ascending or descending order.
Customize Columns
You can select the columns displayed to customize the table for the data you want to view.
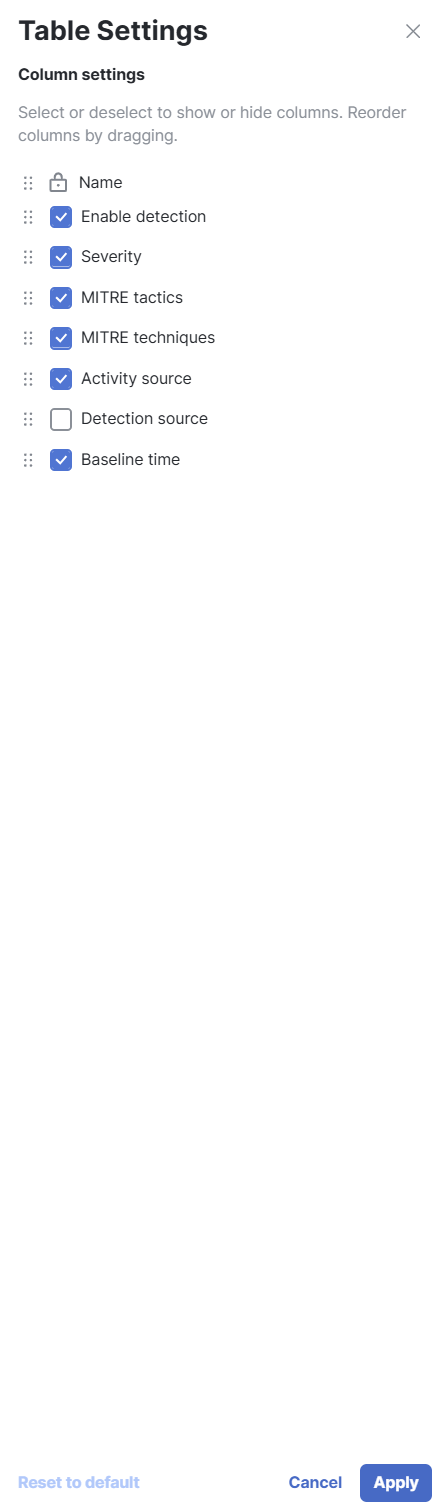
Click the  (Settings) icon to open the Table settings drawer and check the check boxes next to the columns you want displayed in the table. The
  (Lock) icon indicates that the column is mandatory and it is always displayed in the table. You can reorder the columns by clicking the
Click Reset to default to reset the table settings to the default values.
View Detection Settings in Drawer
When you click a detection in the table, the Detection settings drawer opens where you can quickly view the description and settings for the detection.
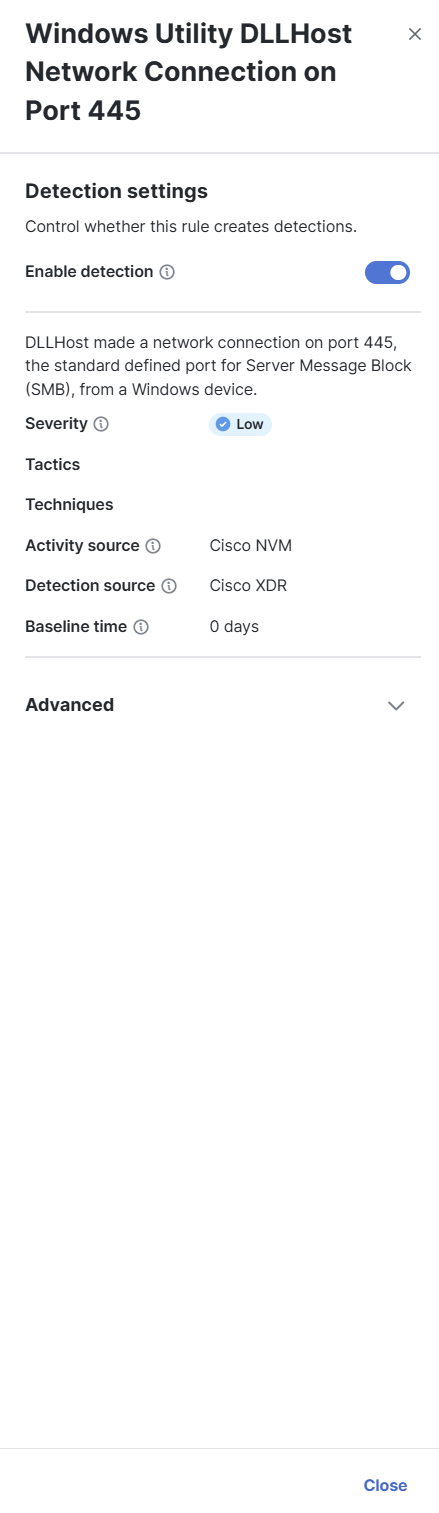
The drawer displays the following information about the detection:
Drawer Header
The upper portion of the drawer shows the name of the detection.
Detection Settings
The Detection settings panel shows the enable detection setting. Click the toggle to enable or disable the detection from being created based on matching activity. When enabled, these detections may be included in incident correlation.
Detection Summary
The summary panel shows the following information:
|
Description |
A summary of the detection and why this may indicate malicious behavior. |
|
Severity |
The severity of the detection defined by Cisco threat research (High, Medium, Low). |
|
MITRE tactics |
The associated MITRE ATT&CK® tactics for the detection. Click the tactic to view the description provided by MITRE ATT&CK®. For a list of all the tactic descriptions, see Enterprise Tactics. |
|
MITRE techniques |
The associated MITRE ATT&CK® techniques for the detection. Click the technique to view the description provided by MITRE ATT&CK®. For a list of all the technique descriptions, see Enterprise Techniques. |
|
Activity source |
The activity sources required for the detection. |
|
Detection source |
The system or product that generated the detection. |
|
Baseline time |
The number of days of data collection required before the detection can trigger. |
Advanced
Expand the Advanced panel to view the Always create incident setting. Detections are automatically evaluated to determine when incidents are created and correlated with other detections. To override the default behavior and always create an incident when this detection is generated, click the Always create incident toggle.
Note: The Always create incident setting is disabled by default and should be used selectively.